All Posts
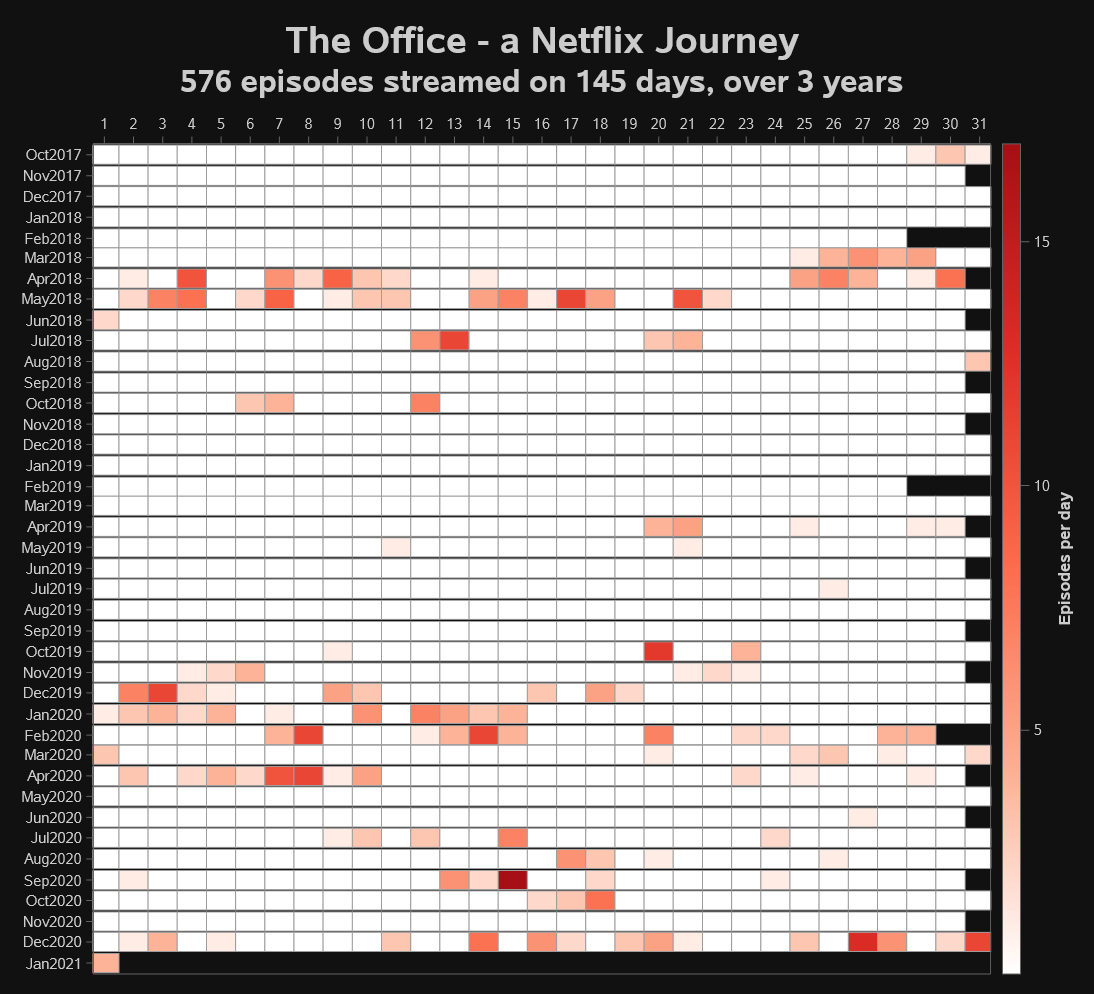

Over 57 billion minutes of The Office was streamed in 2020. My family bears some responsibility. Here's our activity visualized -- using SAS.


What if you had a technology solution that creates a real-time link between the customer demand signal and what's happening on the ground? What if plans that are being steered centrally could finally be connected to every shipping lane, while simultaneously, creating cost saving carrier adjustments? The first-of-its kind integration
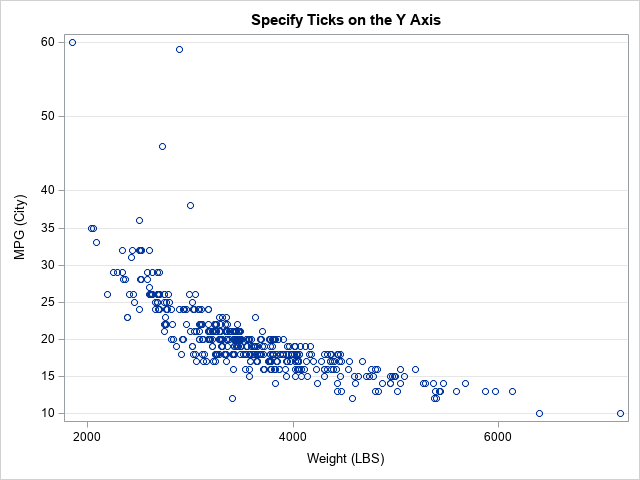

Have you ever heard of the DOLIST syntax? You might know the syntax even if you are not familiar with the name. The DOLIST syntax is a way to specify a list of numerical values to an option in a SAS procedure. Applications include: Specify the end points for bins


The management of the COVID-19 vaccination program is one of the most complex tasks in modern history. Even without the added complications of administering the vaccine during a pandemic, the race to vaccinate the populations who need it most all while maintaining the necessary cold-storage protocols, meeting double dose requirements,

지난해는 전례없는 코로나19 대유행으로 전 세계의 각국 정부 및 기업은 코로나19로 인한 위기를 극복하고자 디지털 트랜스포메이션을 통한 혁신을 가속화한 한 해였습니다. 불확실성 속에 찾아온 2021년, SAS의 여러 전문가들은 2021년 데이터 분석 트렌드를 인공지능(AI), 클라우드, 백신 등의 키워드를 통해 전망했습니다. 2021년 주목해야 할 데이터 분석 8가지 트렌드를 소개합니다. 기업의 임원들이 AI를

SAS가 클라우드 시장 및 타사 애플리케이션 등에 AI 접목을 촉진하기 위해 로우코드/노코드 애플리케이션 배포 및 분석 워크로드 관리 전문 영국 비상장 회사 보엠스카(Boemska)사를 인수했습니다. SAS는 이번 인수로 획득한 기술을 SAS Viya에 적용해 고객의 클라우드 분석 관련 비용을 절감하고, 모델을 모바일 및 엔터프라이즈 앱 등에 이식할 수 있게 될 예정입니다. 이를


SAS Cloud solutions on Azure help banks by delivering reliable stress test results fast.
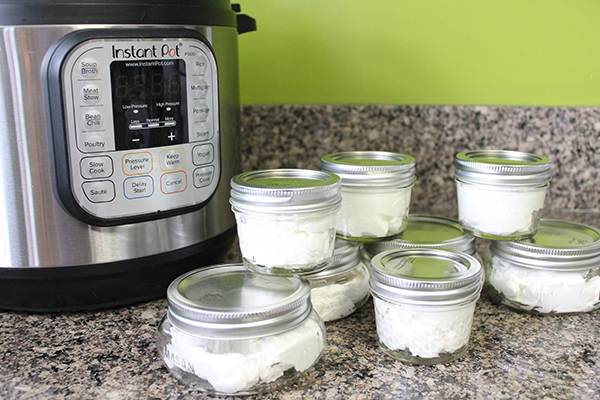

When I purchased my Instant Pot a few years ago I didn’t think twice about having the Yogurt function included because I knew I would never make homemade yogurt. Bacteria, fermentation, boil, cool, incubate…so much potential room for error…no thanks. However, I finally got up the nerve to give it


SAS' Leonid Batkhan demonstrates a popular "divide-and-conquer" efficiency strategy using SAS/Connect®.


Many countries in Europe have in previous years experienced increased price competition for general insurance products. Especially in Southern Europe, the competition has been very fierce, fueled by online price comparison websites. In Spain, Portugal and Greece, there has been a substantial drop in average premiums for products like motor,
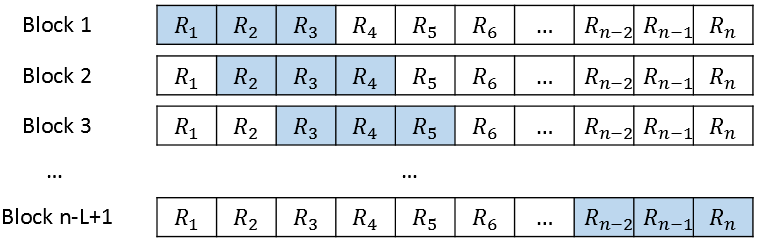
As I discussed in a previous article, the simple block bootstrap is a way to perform a bootstrap analysis on a time series. The first step is to decompose the series into additive components: Y = Predicted + Residuals. You then choose a block length (L) that divides the total


Last week I read an article that suggested writing a “done” list at the end of each day before identifying the 2-3 priority “to do” items for tomorrow. Ok, I’ll bite. Over the last several months I have been trying all sorts of organization and efficiency habits, so I decided


From mental health to biodiversity, SAS is committed to using data for social innovation, committing our resources, analytics expertise and software to tackle global issues. It's a vital undertaking, and we can't do it alone -- strategic partnerships are key to these efforts. Here's a quick overview of our top

On The DO Loop blog, I write about a diverse set of topics, including statistical data analysis, machine learning, statistical programming, data visualization, simulation, numerical analysis, and matrix computations. In a previous article, I presented some of my most popular blog posts from 2020. The most popular articles often deal
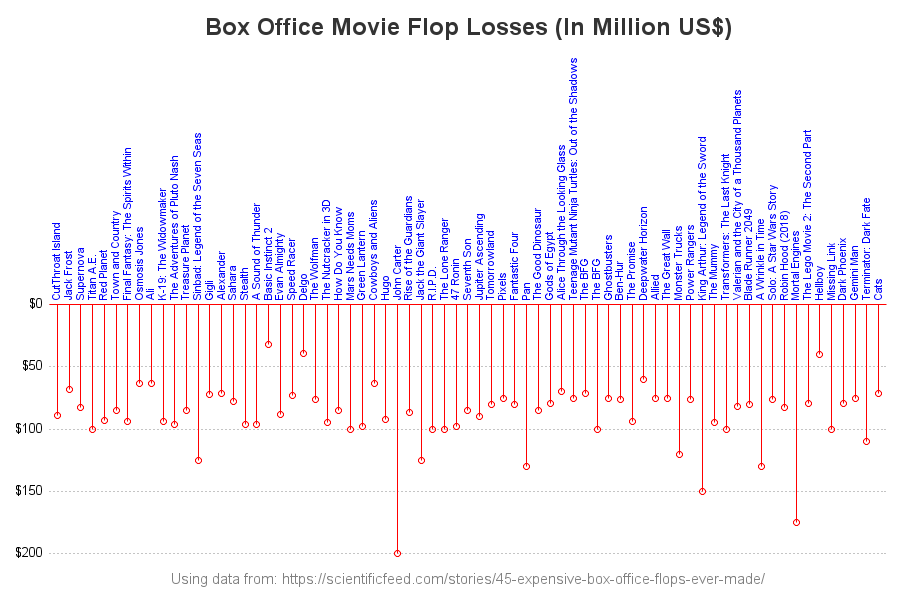

If you've been stuck at home a lot lately, and think you have run out of movies to watch -- think again! Here is a list of big-budget movies you might not have seen, because they flopped (lost lots of money). Follow along as I show you how I created