All Posts


Artificial intelligence undoubtedly remains a key trend when it comes to picking the technologies that will change how we live, work and play in the near future. As always, with great power comes great responsibility. There are many benefits that AI solutions bring to the world. But poor design or


In 2020 alone, the global losses from natural disasters amounted to a staggering US$210 billion! This is just short of the 2020 GDP of Portugal, or a little more than twice the market cap of HSBC, Europe’s largest bank. The causes of these huge losses include drought-fuelled wildfires, severe floods
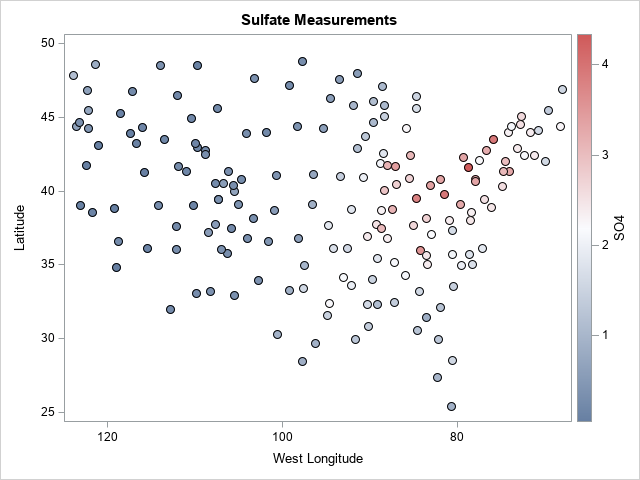

This article shows how to use PROC SGPLOT in SAS to create the scatter plot shown to the right. The scatter plot has the following features: The colors of markers are determined by the value of a third variable. The outline of each marker is the same color (such as

Contents 변화는 기회를 만든다! 2021년 주요 변화 동인 금융산업 Analytics 고도화를 위한 주요 Trends 변화는 기회를 만든다! 1968년 멕시코 올림픽 이전에 육상 높이뛰기는 ‘엎드려뛰기’나 ‘가위뛰기’가 일반적인 방식이었으며, 200cm 이상을 뛰어야 메달권에 들어갈 수 있었다. 하지만, 1963년 메드퍼드 고등학교 2학년에 재학 중이던 Dick Fosbury는 높이뛰기 선수 테스트에서 160cm를 넘는데 실패하였다. 사실
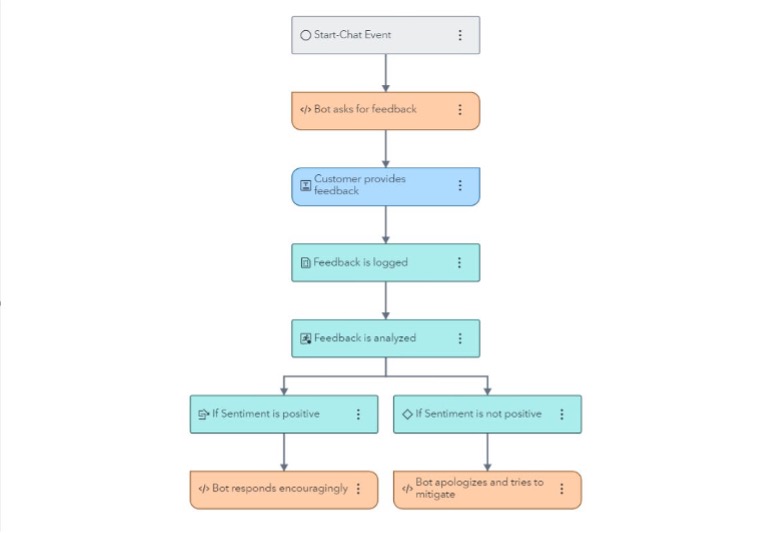

SAS Conversation Designer is available with every offering that also includes SAS Visual Analytics. Users can easily access Visual Text Analytics capabilities from SAS Conversation Designer with minimum additional configuration.


Written by RFC Staff. Known for their fancy turns and agility, Recreation and Fitness Center (RFC) staff innovatively support SAS employee health with fitness, wellness, and recreation programs. We pride ourselves on being part of SAS's wellness team inspiring and empowering those who inspire and empower with the most trusted

Linear programming (LP) and mixed integer linear programming (MILP) solvers are powerful tools. Many real-world business problems, including facility location, production planning, job scheduling, and vehicle routing, naturally lead to linear optimization models. Sometimes a model that is not quite linear can be transformed to an equivalent linear model to reduce


A Deep-Q Network (DQN) is a reinforcement learning technique that attempts to model the actions that perform best in each state in real-time.


Se dice que la pandemia aceleró los procesos de transformación digital de muchas empresas en por lo menos 5 años. Para el caso de las empresas del sector bancario esta estimación puede ser aún mayor. Debido a la pandemia del COVID-19 y según cifras de la Superintendencia Financiera, en Colombia la banca móvil y la banca por internet crecieron


Los datos están vivos y evolucionan con el transcurso de los años. Por otro lado, la realidad que vivían las empresas hace unas décadas dista bastante de la actual, y esta “fotografía” está en constante movimiento. En este contexto, ¿cómo ha cambiado el papel de la analítica de datos en


As I sit and write this blog, the rain is coming down. The rain absorbs into the plants and Earth and supplies its liquid goodness to the aquifers in the ground promoting life above. Earth is a water planet and our bodies are 70% water. We started our beginnings in
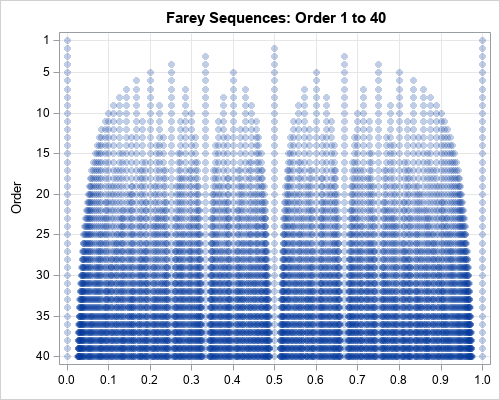
Here is an interesting math question: How many reduced fractions in the interval (0, 1) have a denominator less than 100? The question is difficult is because of the word "reduced." If we only care about the total number of fractions in (0,1) whose denominator is less than 100, we


SAS' Leonid Batkhan reveals coding techniques that give you control of when and whether global statements are executed.
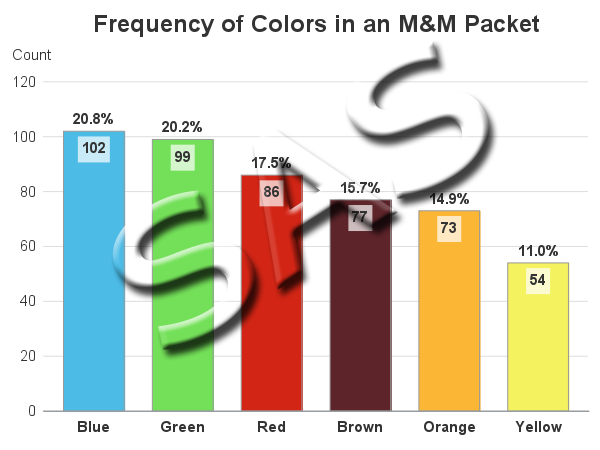

This is another in my series of blog posts where I take a deep dive into converting customized R graphs into SAS graphs. Today we'll be working on bar charts ... And to give you a hint about what data I'll be using this time, here's a picture from a SAS


Learn why a data catalog is so valuable in helping you find and use big data at your business.