All Posts


By starting from a set of purely declarative statements, any zebra puzzle with limited constraints can be tagged and solved quickly in the same way without changing any code.
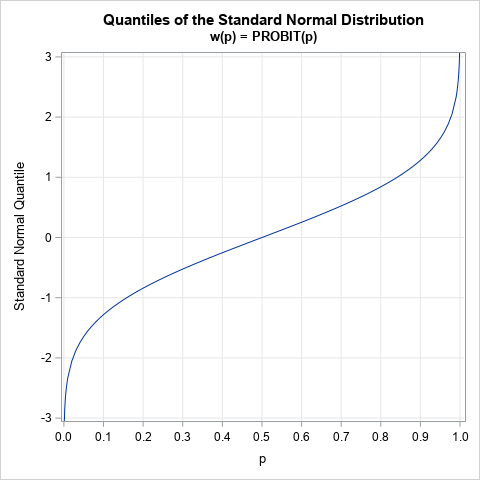

The graph to the right is the quantile function for the standard normal distribution, which is sometimes called the probit function. Given any probability, p, the quantile function gives the value, x, such that the area under the normal density curve to the left of x is exactly p. This


Desde que el IASB emitió la versión final de IFRS 9 Instrumentos Financieros (IFRS 9), las organizaciones financieras han estado concentradas en su comprensión, interpretación y cumplimiento. Temas la medición y reconocimiento de activos y pasivos, la contabilidad de coberturas y el modelo de deterioro bajo el esquema de


Los riesgos empresariales son inevitables, pero gestionables. Por más controlada que un líder pueda tener la operación de su empresa o por más planeadas que tenga sus proyecciones y crecimientos, siempre estará expuesto a diferentes riesgos. Y también a soluciones. Desaceleración económica, interrupción del negocio, escasez de materiales, precio de


Have you ever heard something referred to as the bee’s knees? Most likely the person uttering that expression meant that it was truly amazing and extraordinary. Maybe you stopped and pondered the origin of the phrase. Well wonder no more! In the 1920s in the United States, people were obsessed
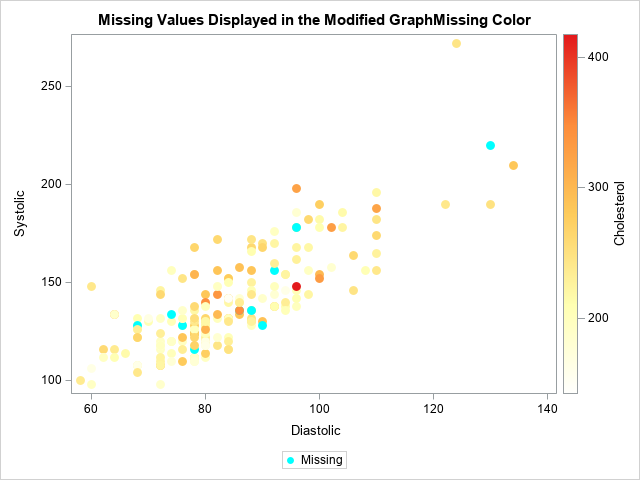
Oh, no! Your boss just told you to change the way that SAS displays certain features in graphs, such as missing values. But you have a library of hundreds of SAS programs! Do you need to modify all of your previous programs? Fortunately, the answer is no. SAS provides ODS

Curiosity Forever SASは約束します。データの探索や、アナリティクスそして学習、これらの進化を止めません。好奇心と能力が出会う時、世界は前進するからです。 SASは、”Curiosity=好奇心”から生まれるユニークで大胆な問いに対して、アナリティクスを用いて解を探すことを大切にしています。これまでにも自然やウェルネス・教育・スポーツなど多岐にわたる分野の好奇心溢れる問いに取り組んでいます。そしてこのCuriosity Foreverを、現代の子どもたちが体験できる環境を築くことが、私たちの未来を豊かにすると考えられます。 データネイティブの世代を育てる準備ができていますか? 1990年代半ばから2000年代前半に生まれたZ世代は、これまでで最も多様性に富み、最も教育水準の高い世代であり、社会変革の原動力として位置づけられています。2014年、Monica Rogati氏は データネイティブという言葉を作り、「データネイティブは、自分たちの世界がスマートで、自分たちの好みや習慣に一貫して適応することを期待している」と述べました。データネイティブの子どもたちは読書量、成績、スクリーンの使用時間などを記録するようになります。スマートで、プログラム可能で、データが豊富な世界で育ちながら、彼らは毎日データに浸かっていると言えるでしょう。 Z世代が社会で活躍する時代の到来とともにテクノロジーも進化し、私たちは膨大なデータを持つことになります。データはこれまで学術研究や政府の政策など、社会の一部に限定されたツールでしたが、今や主流になりつつあり、専門家だけでなく全ての人がデータリテラシーを身につけることが不可欠です。 若者がデータリテラシーへの関心を高める鍵は、生徒が関心を持つ問題にデータリテラシーを結びつけることにあります。これまでの学校教育におけるデータは、数学などの科目でデータの基礎として扱われることが多いです。しかしデータの活用が出来る分野には、社会的不公正との戦い、環境保護、飢餓との戦いなど世の中の実際に起こっていること・子どもたちにも身近なことに広がっていて、それらを通じて若者の生来の情熱に訴えかけることができます。また、データがどのように責任を持って使われ、進歩やイノベーションを促進するのか、子どもたちに伝えましょう。それと同じくらい重要なのは、データサイエンスの分野に自分たちが反映されていることを確認することです。この分野への参加を広げ、多様性を高めることは、社会的格差の縮小に取り組む上で最も重要なことです。 わたしたちはデータに慣れ親しむZ世代の探究心や情熱とともに、私たちは創造性と革新性を育む環境を育み、社会全体をよりよい方向に進めていく必要があります。 ※このセクションはAre we prepared to raise a generation of data native?の内容を要約しています。詳細はこちらをご参照ください。 Curiosity: 東京は暑い! 筆者もZ世代の学生として、好奇心からアナリティクスにつながるちょっとした体験をしました。 上京してきた際に「東京って思ったよりも暑いんだ」と感じてから、都市部の暑さに興味を持ちました。近年、夏に注意を促される熱中症。毎年患者数が増加しており、日本全体で暑さに関する対策として緑のカーテンなど緑化を行っています。しかし、その緑化はどれくらい効果があるかピンとこない気がしていました。そこで今回は仮説として、「緑地率が高い区ほど熱中症患者数が少ない」を立てたので、東京都23区の緑地率と熱中症患者数にどのような関係があるかについて確かめたいと思います。 上図は、年次ごとに東京都23区の100万人当たりの熱中症患者数と緑地率(AVNIR-2の光学センサの衛星データより緑地を抽出して求めた割合)の相関を確かめるために作成した散布図です。 散布図から、6年分全体でみて緑地が増えると熱中症患者が減るという傾向は読み取れませんでした。相関係数0.4と正の方向に相関が少し出ていますが、年次で色分けした部分で縦軸方向に層ができているように見えるので、相関係数のみで判断するのは難しいと考えました。また区ごとに時系列で比較したとき、たった6年で緑被率に大幅な差がありました。これは私が取得できた衛星データに雲がかぶっているなどの原因で、緑地率のデータが正確でないためである可能性もあります。 今回の観察期間で熱中症患者数は年々増加しており、機会があれば、緑地率以外に考えられる要因を集めて影響度を確かめてみたいと思いました。 このように日常生活でふと気づいた疑問を積極的に考えて、実際はどうなんだろうか、何か出来ることはないかとアナリティクスを用いる動きは、学生の好奇心を刺激しデータ活用の第一歩となります。学生の皆さん、いま浮かんだ疑問をデータを使って深掘りしてみませんか? What are you curious about?

Editors note: This is the first in a series of articles. According to the Global McKinsey Survey on the State of AI in 2021, the adoption of AI is continuing to grow at an unprecedented rate. Fifty-six percent of all respondents reported AI adoption – including machine learning (ML) –


On s'accorde de plus en plus à dire que presque toutes les entreprises devront recourir davantage à l'analyse. L'utilisation des données n'est plus un luxe, mais une méthode de travail essentielle. C'est un facteur d'efficience, d'efficacité et de centrage sur le client. Pour ceux d'entre nous qui travaillent dans le


La tecnología o la experiencia de cliente son algunos de los factores que más peso están adquiriendo en la evolución que vive el sector Seguros. Así, en los últimos años estamos observando un interés cada vez mayor en la ciencia de datos y aplicaciones de machine learning de las compañías
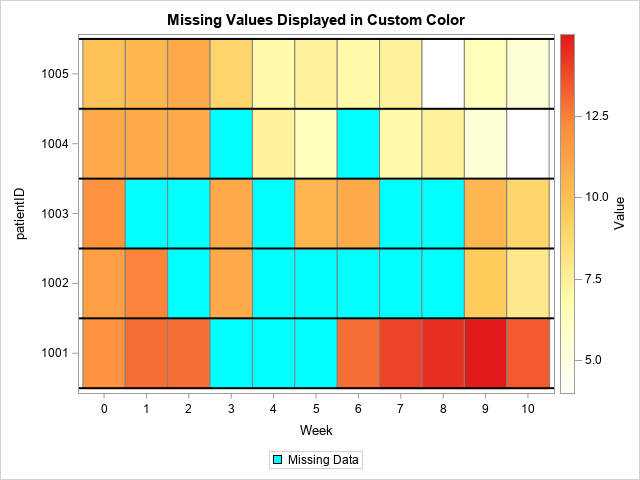
In an article about how to visualize missing data in a heat map, I noted that the SAS SG procedures (such as PROC SGPLOT) use the GraphMissing style element to color a bar or tile that represents a missing value. In the HTMLBlue ODS style, the color for missing values


Traditionally, banks have been seen as the front line in anti-money laundering activity. They have increasingly been subject to regulatory requirements to check customers, transactions and activity. However, as governments have required banks to make fraudulent activity harder, criminals have evolved their tactics. And the financial sector needs to keep


Traffic collisions are the second leading cause of firefighter deaths in the United States and most of these collisions occur at intersections. That statistic, together with a vision to apply a combination of AI and IoT to find a solution for all emergency vehicle collisions inspired the Team Hackanadians in


I was recently told that an organization had tried to implement AI for forecasting in supply chain but had failed due to poor data. This got me thinking about exactly what the impacts of poor data would be. And whether the approaches I had applied elsewhere could help. It's probably


Over the last two years, the Future of Work has been the topic of fervent discussion: Is the traditional office dead? Is hybrid work possible? Will we all go remote? Recently, with the decrease in COVID-19 case numbers and return to semi-normalcy, conversation about the Future of Work has changed