Looking backwards, looking forwards: SAS, data mining, and machine learning

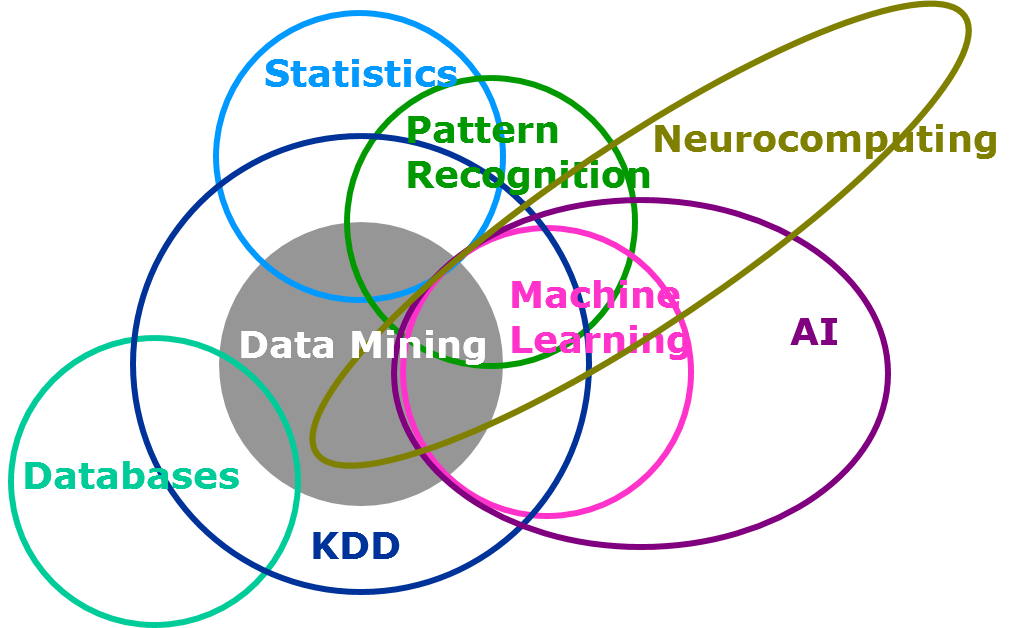
Looking forward, ten of my SAS colleagues and I are heading to New York City this weekend for KDD 2014: Data Science for the Social Good, which runs August 24-27. This event’s full name is the 20th Association for Computing Machinery Special Interest Group on Knowledge Discovery and Data Mining,