SAS Visual Investigator has an attractive user interface. One of its most engaging features is the network diagram, which represents related ‘entities’ and the connections between them, allowing an investigator to see and explore relationships in their source data. For maximum impact, each entity in the network diagram should have an
Search Results: Visual Analytics (1629)

As analytics advances into more areas of our everyday life there is an increased need to understand just what it is that analytics is accomplishing for us. I find there is a quicker acceptance of an analytical solution and even excitement if there is a good conceptual understanding of what
The government has an unfathomable amount of data -- and it grows more and more each year. This puts agencies in a unique and important position to use that data for good. Whether it be improving government operations, solving some of the nation’s biggest challenges or empowering citizens in new

ODER: Wie erstelle ich ein Edge Analytics Case auf Basis von SAS ESP, SAS Streamviewer und eines Modelltrucks? Das beschreibe ich in Teil 3. Rückblick: Im ersten Teil wurden die Idee und der Inhalt der SAS Streaming-Analytics-Demo beschrieben. Im zweiten Teil sind die einzelnen technischen Komponenten sowie die Software aufgelistet. Im

ODER: Wie erstelle ich ein Edge Analytics Case auf Basis von SAS ESP, SAS Streamviewer und eines Modelltrucks? Im ersten Teil wurde die praxisnahe Demonstration von SAS Streaming Analytics anhand eines Modelltrucks beschrieben. Für den Aufbau eines funktionsfähigen Modells, das mit einer Fernbedienung in Bewegung gesetzt werden kann, werden folgende
In my first post of this blog series, we learned how three education customers are using SAS. Today, we'll hear about the positive impact that SAS and analytics are providing for users and the education institutions. In this post, you'll hear from: Linda Sullivan, Assistant Vice President for Institutional Knowledge Management,

What’s your favorite time of day? For me, it’s the morning with a cup of coffee, just as the sun starts to appear on the horizon, emitting a pleasant warm glow. My least favorite part of the day? Mornings without coffee when that same big ball of light makes a
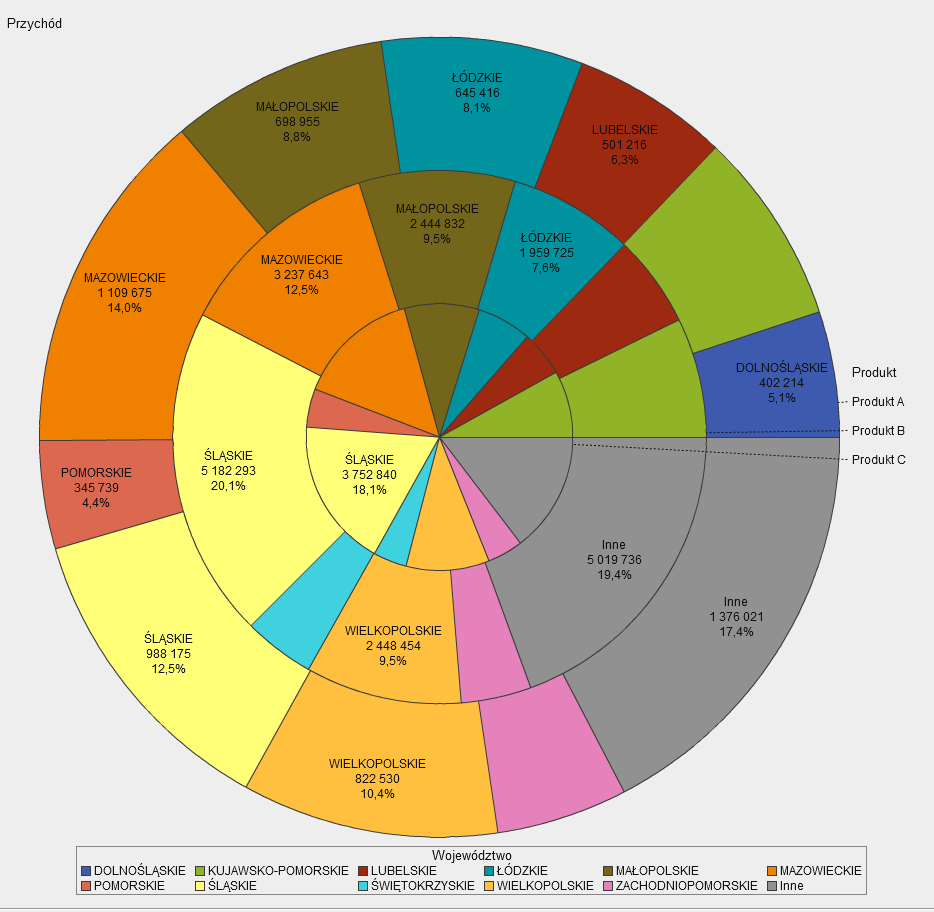
INTERNATIONAL BUSINESS COMMUNICATION STANDARDS is an organisation defining international standards in business communication and presenting proposals relating to designing easy-to-understand business reports and presentations.
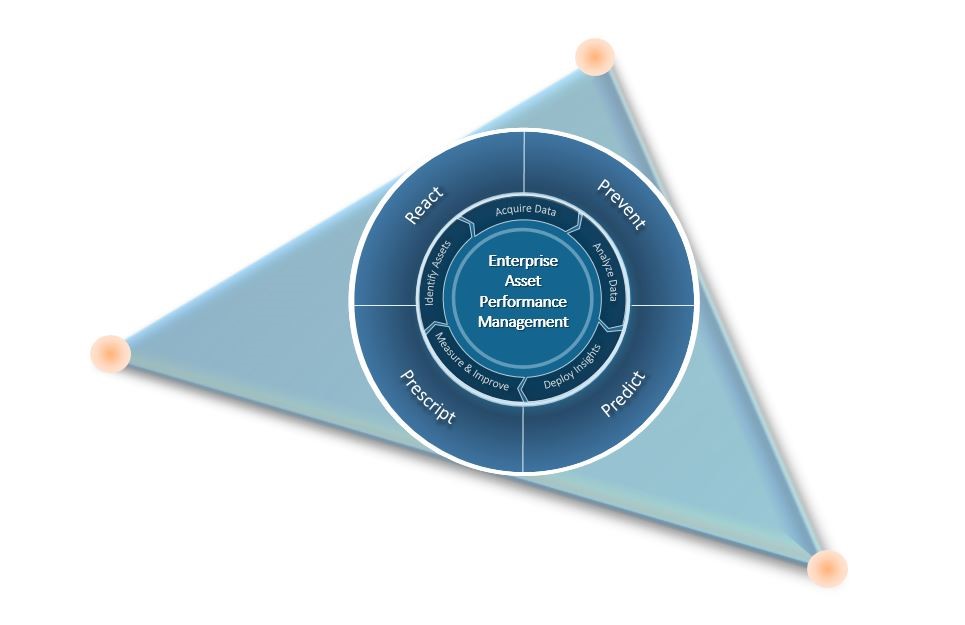
In an increasingly complicated operating environment, the global oil and gas industry struggles to optimize their asset portfolio. Producers combat severe challenges inherent to aging facilities in the context of pricing volatility. Change is the new constant, as the cyclical nature of the oil and gas industry means that producers

Recently, I interviewed three SAS customers to understand firsthand how each is using data visualization and analytics in education. In this education analytics series of blog posts, I’ll take you on a journey to learn how each of these customers are turning their data into insights to be a more

Edge Analytics ist zweifellos eines der „Next Big Things“. Noch vor ein, zwei Jahren nicht mehr als ein ambitioniertes Konzept, sind jetzt die Voraussetzungen für ganz reale Anwendungen da. Wie so etwas aussehen kann, will ich anhand eines scheinbar spielerischen, aber tatsächlich einsatzbereiten Beispiels zeigen: dem analytischen Truck. In diesem

SAS is hosting the premier analytics conference in the world September 18-20 in Washington DC, and supplementing the event with discounted training and certification exams at SAS Analytics Experience 2017. These offerings will be held before and after the event. As at other SAS events, we will be offering certification exams at
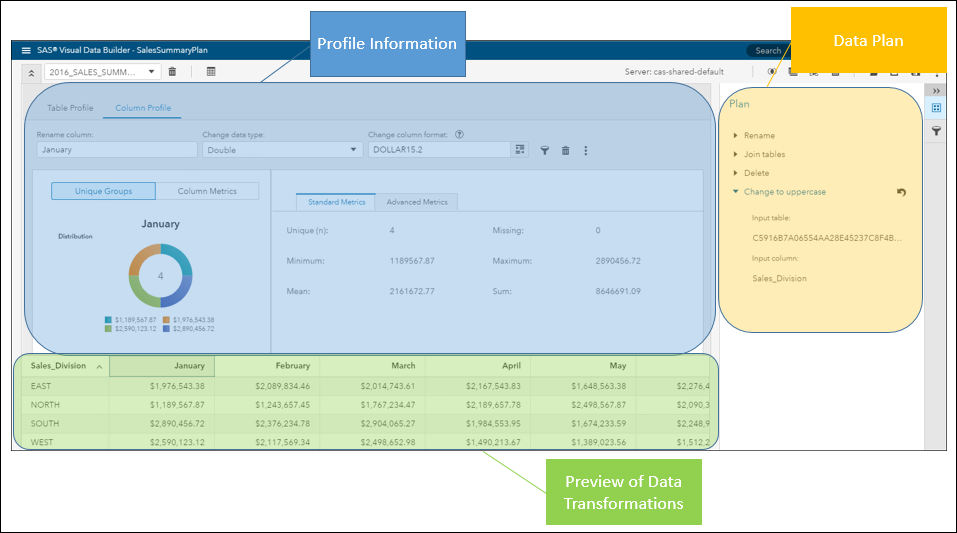
In SAS Viya 3.2, SAS Visual Data Builder provides a mechanism for performing simple, self-service data preparation tasks for SAS Visual Analytics or other applications. SAS Visual Data Builder is NOT an Extract, Transform and Load (ETL) or data quality tool. You may still need one of those tools to

Helmut Plinke explains why modernizing your data management is essential to supporting your analytics platform.

The role of analytics in combating terrorism Earlier this spring, I found myself walking through a quiet and peaceful grove of spruce trees south of the small hamlet of Foy outside of Bastogne, Belgium. On travel in Europe, I happened to have some extra time before heading to London. I

Today in higher education, savvy users expect to have the information they need to make data-informed decisions at their fingertips. As such, leaders in institutional research (IR) are under pressure to provide these users with accurate data, reports and analyses. IR has been tasked with transforming data and reports in

Regulations, corporate drivers, leadership and market influences have combined to produce a patchwork of uneven progress on initiatives such as distributed generation, customer choice, asset optimization and the industrial Internet of Things. These initiatives all rely on analytics to gain the most return on investment. To better understand organizational readiness

El fraude y los delitos financieros cuestan a los gobiernos millones de dólares al año. Las agencias gubernamentales tienen que buscar más allá de los enfoques tradicionales para combatir estos crímenes cada vez más complejos y comunes. En este sentido y en beneficio de las entidades gubernamentales, la tecnología analítica

Der Interpretationsspielraum zwischen „Bean Counter“ und „Business Partner“ ist immens. Nicht umsonst sind die Meinungen sehr unterschiedlich, welcher konzeptionelle Controlling-Ansatz der „richtige“ ist. Nicht nur in der Wissenschaft, sondern auch in der Praxis findet man deutliche Unterschiede vor, welches Selbstverständnis das Controlling in den Unternehmen hat. Ich möchte heute jedoch

Artificial intelligence. Big data. Cognitive computing. These buzzwords are the ABCs of today’s marketplace. In a recent interview at SAS® Global Forum, I discussed the unprecedented pace of change that we’re seeing in the market. It’s creating what I like to call an analytics economy. In this economy, analytics –
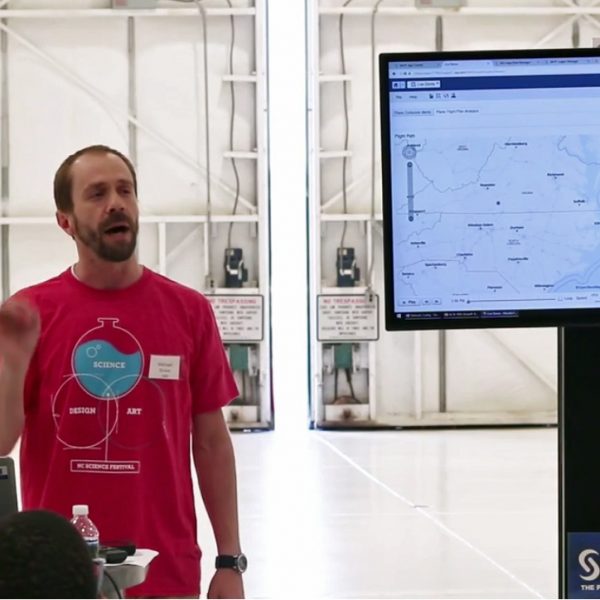
What do you get when you combine analytics, aviation and the Internet of Things? A learning experience that leaves everyone flying high! At Data on the Fly, 25 area high school students had the opportunity to learn how technology has changed – and continues to change – the aviation industry.

Leaders in the education industry understand that when people at all levels have timely access to the right data and reports, they can generate trusted knowledge and insights that help transform programs, curriculums, student outcomes and more. That's how the industry's leaders deliver desired results faster to further student success.
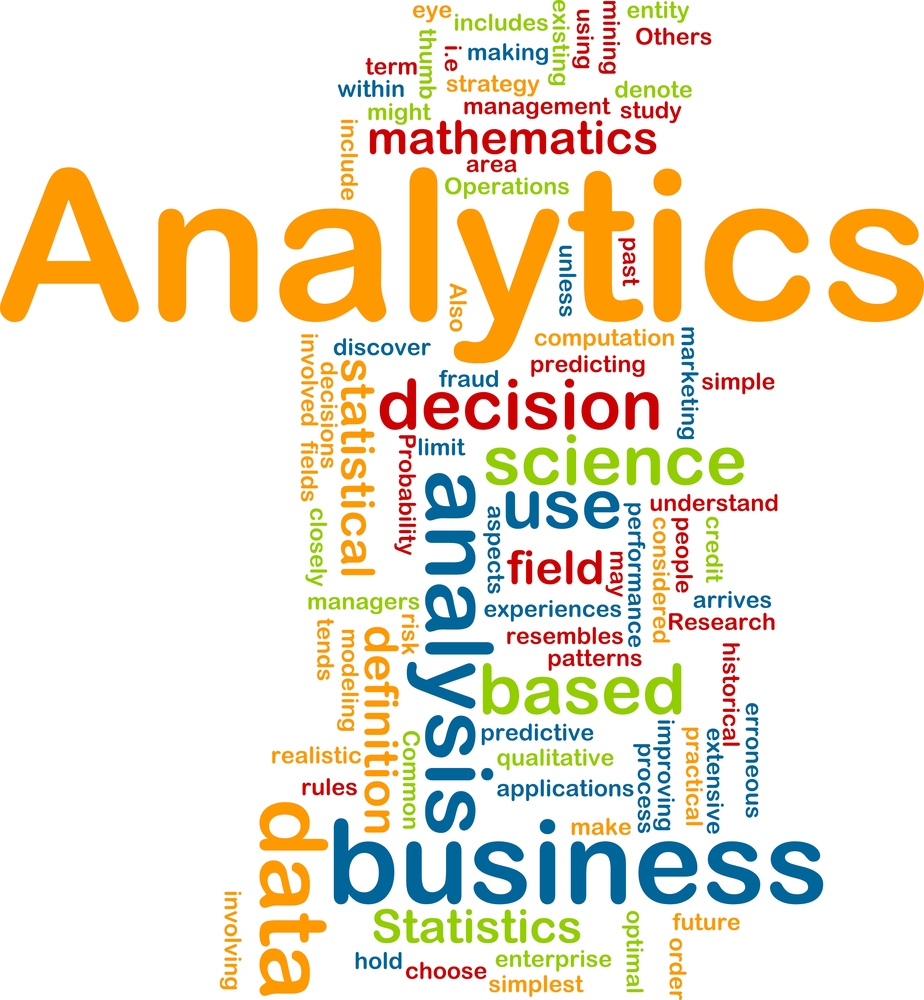
The widespread adoption of the term "analytics" reminds me of the evolution of the term "supply chain management." Initially the term focused on supply chain planning. It involved demand and supply balancing and the heuristics and optimization tools that came out of advanced planning and scheduling. Over time practically everything was included
If you're into data visualization, here's something that might interest you - a free eBook showing several ways to use SAS to visually analyze your data. (Did I mention it's FREE?!?!) We've picked juicy chapters from several books and upcoming books (and a few other sources), to show you what

I have been using the SAS Viya environment for just over six months now and I absolutely love it. As a long-time SAS coder and data scientist I’m thrilled with the speed and greater accuracy I’m getting out of a lot of the same statistical techniques I once used in

When senior leaders at the University of Louisville (UofL) approached Vice Provost Bob Goldstein in early April 2016 with a request for a fully functioning data visualization platform by start of the 2016 fall semester—just four months away—he did not panic. Instead, Goldstein, along with Becky Patterson, Executive Director of

SAS will be well represented at the 2017 INFORMS Conference on Business Analytics and Operations Research, which takes place April 2-4 at Caesars Palace in Las Vegas, NV. Two dozen SAS staff will participate in this conference. SAS/OR, the SAS Global Academic Program, and JMP will have adjacent and coordinated

I’m drawn to immersive analytics (IA) because it covers areas I’ve been looking at since 2012, and have been publishing on since early 2014, like virtual reality and data worlds. I’m retroactively applying the cool new term IA (not to be confused with AI for artificial intelligence) to all of my activities
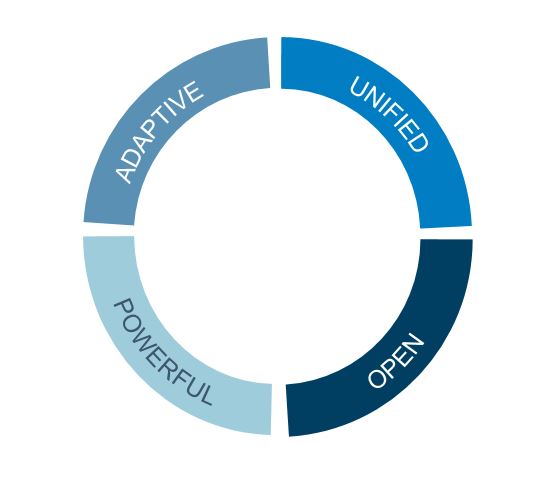
Every where you turn today, you run into analytics. If you talk about big data, you will talk about analytics, if you talk about the internet of things (IoT), you will talk about analytics, if you talk about automation ... well, you get the picture. When used properly, analytics has always
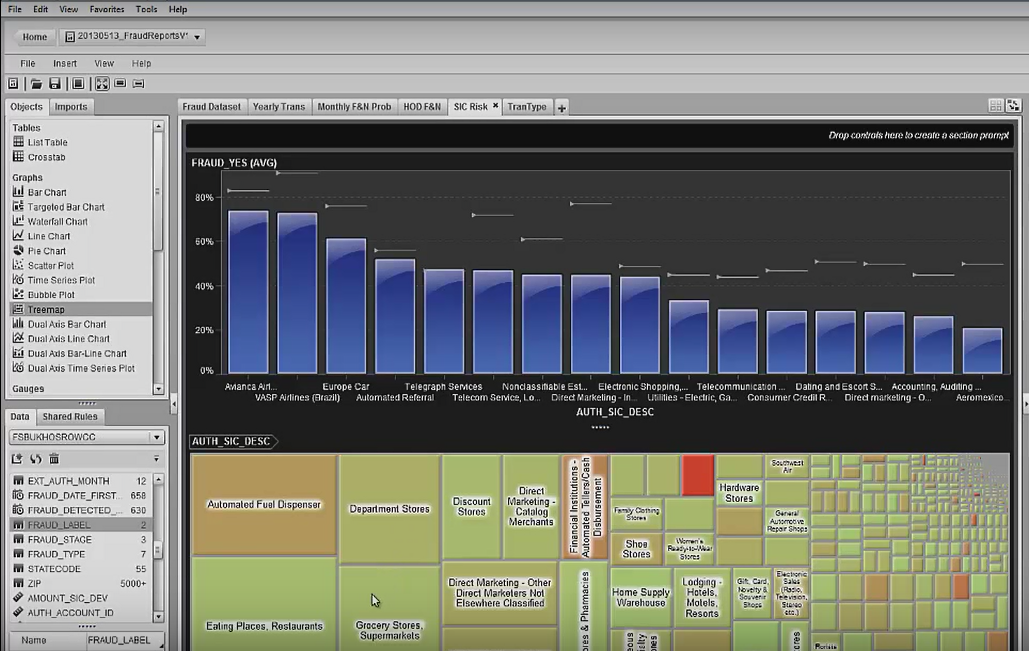
From national security agencies, law enforcement organizations looking to terrorism and criminal activities, internal security, audit and compliance departments, to hospitals and public health organizations guarding against disease outbreaks, there are many common needs and constant challenges, e.g.: Detect an event of interest in the early stages. Investigate suspicious events


