I’m drawn to immersive analytics (IA) because it covers areas I’ve been looking at since 2012, and have been publishing on since early 2014, like virtual reality and data worlds. I’m retroactively applying the cool new term IA (not to be confused with AI for artificial intelligence) to all of my activities in this area.
What it is
Immersive analytics is a term adopted by IEEE that originated out of Monash University in Australia. It is an emerging research thrust focused on the use of virtual reality (VR), augmented reality and other new display and interaction technology to support analytical reasoning and decision making.
What it’s not
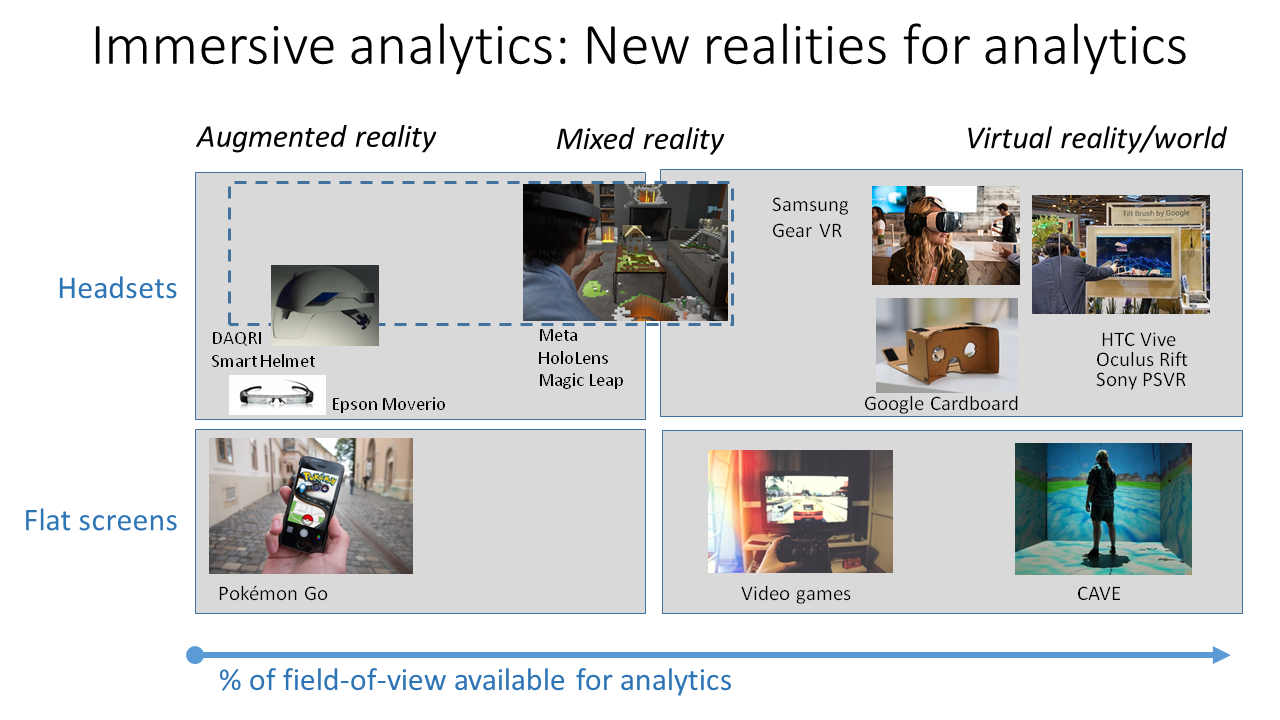
It is not just virtual reality for analytics or just augmented reality analytics. It encompasses a spectrum of technologies including augmented reality, virtual reality as well as more traditional mobile and non-mobile flat screens.
 How it works
It’s really about the intersection of realities with analytics. With these new technologies, you can augment reality with analytics, make reality from analytics or do both at the same time. One simple use case would be a smart phone or tablet app that is like Pokémon Go, but instead of seeing Pokémon you see analytics pertaining to IoT sensors that are in your physical view. This use case can translate to augmented reality headsets where you are always heads-up. While augmented reality is constrained to the immediate physical world, augmented virtual reality can analytically augment a reality halfway around the world.
Also, realities can be created entirely from analytics. For example, SAS Event Stream Processing can output streaming analytics at the rates that high definition screens can display data, including the high definition screens in virtual reality headsets. This means more data down the optic nerve to cognition.
When people first hear about this vision, they often worry about data overload. While that's a real concern if you stick to the traditional canon of data visualization dating back to the 1700’s, our current situation is different. You never hear people complaining about data overload when they go from a lower resolution screen to a higher resolution screen, like a 4K TV. But the digital signal coming in to the screen is data – 0’s and 1’s.
The difference is that traditional data visualization is largely about reading data, while the opportunity for data reality is about perceiving streaming data at much higher throughput rates, including real time streaming data. While traditional data visualization is great for augmenting reality, physical or virtual, data reality needs a new class of reality metaphors for expressing data.
Immersive analytics also includes large flat screen displays. The research and tools driving virtual reality and mixed reality overlap with the advanced graphics seen in flat screen games. There are many more flat screens in the world than AR or VR headsets, so it’s important for immersive analytics to play well on existing flat screen technology when the use cases are a better fit for flat screens.
The possibilities
With IoT becoming so important, don’t you want to see it? Seeing IoT means more than just looking at charts of data from sensor activity last month. It means using augmented reality to see IoT right around you, augmented virtual reality halfway around the world and having field workers and remote analysts share a concurrent view of the reality surrounding the field worker. For example, a first responder with AR could work with a remote analyst using VR to thwart an IoT based cyberattack.
With data reality techniques, a network firewall could have sentries that watch for potential intrusions in real time. They put on VR headsets and have a 360 degree view of their network that could even include 360 degree data driven sound. In this way, human intuition can aid automated alerting and other computational techniques in confronting attacks.
While real time use cases are important, the streaming data can also be historical. Past events can be replayed and studied in a more enlightening presentation than can be achieved with 18th century charts printed on paper.
The bottom line
With a strong showing of VR at National Retail Federation and other business-focused events this year, the market for immersive analytics is forming. Immersive analytics doesn’t replace tried-and-true data visualization but rather leverages new hardware and software technologies so that data can be perceived in new ways and in the context of physical and virtual realities.