Featured

Top posts about the topics you care about most.
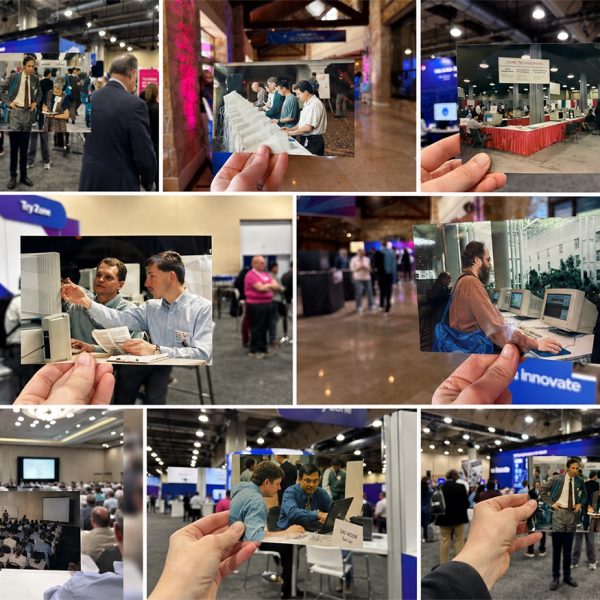
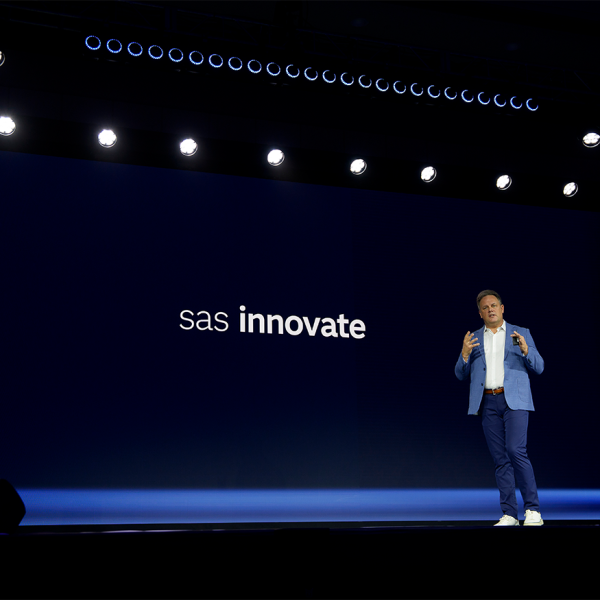
Data Visualization
Cindy Wang 0
How to Visualize Time Series Decomposition using SAS® Visual Analytics

Time-series decomposition is an important technique for time series analysis, especially for seasonal adjustment and trend strength measurement. Decomposition deconstructs a time series into several components, with each representing a certain pattern or characteristic. This post shows you how to use SAS® Visual Analytics to visually show the decomposition of

Analytics | Students & Educators
Lisa Morton 0
College-bound students with visual impairments learn to independently analyze data

This summer the Accessibility and Applied Assistive Technology team at SAS launched a new course that teaches students with visual impairments how to independently analyze data, which is a critical skill that all students need for success in college and their careers. However, many students with visual impairments don’t have

Analytics
Serge Boulet 0
Do you need data hunters?

Without the right data, any analytics initiative is just an illusion. For machine and deep learning efforts, new sources of data are always in demand. In a few of our Innovation at Scale study interviews, respondents pointed to the rising need for data hunters. I asked our resident guru on

1 11 12 13 14 15 18

Back to Top