SAS Users
Providing technical tips and support information, written for and by SAS users.
Foresight is 2020! New books to take your skills to the next level
Are you ready to get a jump start on the new year? If you’ve been wanting to brush up your SAS skills or learn something new, there’s no time like a new decade to start! SAS Press is releasing several new books in the upcoming months to help you stay

Why does my SAS date have the wrong century?
2020 is here and systems that use 2-digit years in date values are getting confused. Do we mean 1920 or 2020? In SAS, the YEARCUTOFF= option lets you decide.

Adventures of a SAS detective and the fantastic FIND function
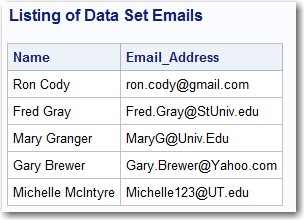
Did I trick you into seeing what this blog is about with its mysterious title? I am going to talk about how to use the FIND function to search text values. The FIND function searches for substrings in character values. For example, you might want to extract all email addresses


