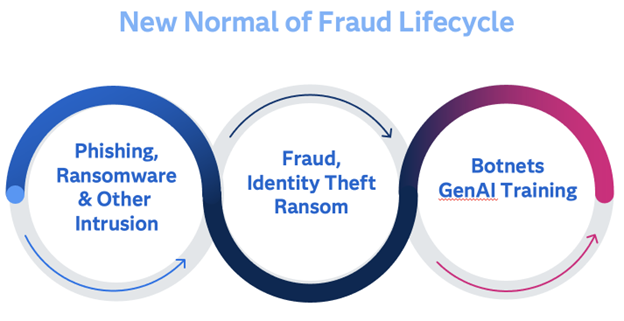
The other day, I was looking at an enterprise architecture diagram, and it actually showed a connection between the marketing database, the Hadoop server and the data warehouse. My response can be summed up in two ways. First, I was amazed! Second, I was very interested on how this customer uses
English

This blog post discusses the use of a black background in a graph. But before we get started, I invite you to have a listen to one of my favorite songs - "Paint it Black" by the Rolling Stones. Perhaps this song subliminally persuaded people to use black backgrounds in

In this edition of our “We Heard You” blog series, we present responses to the surveys you submitted last year with your suggestions and feedback about the scheduling and structural changes introduced in 2014. We sifted, synthesized, and prioritized changes based upon trends and your great ideas! Here are a

There has been a spate of recent high-profile airline crashes (Malaysia Airlines, TransAsia Airways, Germanwings,...) so I was surprised when I saw a time series plot of the number of airline crashes by year, which indicates that the annual number of airline crashes has been decreasing since 1993. The data

In February of this year, the Washington Business Journal reported the US Government appointed its first Chief Data Scientist, DJ Patil. With this, I think it’s now safe to say that Data Science is officially sanctioned as new mode in organizations. Those that can apply the necessary finesse along with

In the Cold War techno-thriller WarGames, a marine monitoring a nuclear missile silo deep under the Nevada desert sees a red warning light blink on his console. “Just flick it with your finger,” his colleague tells him. He does, and the bulb goes out. Problem solved. But what will their

In Microsoft Excel, a PivotTable can help you to create an interactive view of summarized data. Within a PivotTable, it’s easy to adjust the dimensions (columns and rows) and calculated measures to suit your ad-hoc reporting needs. You can also create a PivotChart – similar in concept to a PivotTable, but

Do you ever have stress dreams? You know, where you’re taking an exam for which you haven’t studied, or you’re forced to wait tables in a sea of angry restaurant customers? For many of us, the stress nightmare of the modern era involves trying to make sense of a never-ending

Having spent many years in graduate school, and living in the Research Triangle Park (RTP) in North Carolina, I have a lot of friends from other countries. Therefore when I recently saw some stories & graphs about EB-5 visas (where you invest a cool half-million US $ to bypass the

March is national Social Work Month and this year the National Association of Social Workers celebrates its 60th anniversary of facilitating positive social changes and improving the lives of individuals and families. Social work is a profession that considers the needs of others every day. Individuals who dedicate themselves to

It’s March and everyone is enjoying the madness, at least in the US. We are watching 68 college basketball teams compete for the title of NCAA Champion. Those of us watching get involved by selecting a bracket, that is, picking who will win each game. Some pick their alma mater.

Jim Harris says the question of who owns big data is no longer an esoteric concept – it's a frequently debated topic.

In a noisy distribution environment, hotels are in significant danger of becoming commoditized. Differentiating themselves not only from the competition, but from the third party distributors, will be crucial to maintaining a competitive edge, or even just maintaining profitability. In an effort to connect better with guests, most hotel companies

Everyone loves a good conspiracy theory - hopefully you'll enjoy mine about the number of US E1 visas! I was perusing some of the US government charts, and found one on US immigration visas that caught my attention. It was a 3D bar chart, and since I always mistrust 3D

Thank goodness, winter is behind us! Hopefully it took all the germs with it. I hope you were able to dodge the cold and flu bullets this winter. If not, now’s the time to give your body, immune system and eating plan a refreshing kick start. Starting today, build these

There's "big," and then there is "factorial big." If you have k items, the number of permutations is "k factorial," which is written as k!. The factorial function gets big fast. For example, the value of k! for several values of k is shown in the following table. You can

Increasingly, automotive executives want to talk about the "Art of the Possible" in analytics. So we took the opportunity to invite leaders around the industry to an Automotive Analytics Executive Roundtable to share their stories and spark new ideas. A myriad of diverse speakers covered a variety of topics on big data/Hadoop, the

We had a lot of books at the ENAR 2015 Spring Meeting in Miami last week, but these were the top three bestsellers. Analysis of Observational Healthcare Data using SAS by Douglas E. Faries, Robert L. Obenchain, Josep Maria Haro, and Andrew C. Leon Survival Analysis Using SAS®: A Practical

The best graphs are both beautiful and informative - a smooth blend of art and analytics. But more often than not, the two collide rather than blending smoothly... Here is a link to a artistic infographic I recently saw posted by Vendavo on twitter. Their message (80% of your profit is generated

Parents, In a recent essay in the NY Times, Frank Bruni, op-ed columnist and author, exploded the myth that getting into a highly selective school is the key to success later in life. In line with my recent blog, “Parenting and the Sinking of the Essex”, I would like to
I've been in many bands over the years- from rock to jazz to orchestra - and each brings with it a different maturity, skill level, attitude, and challenge. Rock is arguably the easiest (and the most fun!) to play, as it involves the least members, lowest skill level, a goodly amount of drama, and the
Adoption of Hadoop, a low-cost open source platform used for processing and storing massive amounts of data, has exploded by almost 60 percent in the last two years alone according to Gartner. One primary use case for Hadoop is as a data lake – a vast store of raw, minimally processed data. But, in many ways, because

The title of this article makes no sense. How can the number of elements (in fact, the number of anything!) not be a whole number? In fact, it can't. However, the title refers to the fact that you might compute a quantity that ought to be an integer, but is

Sankey Diagrams have found increasing favor for visualization of data. This visualization tool has been around for a long time, traditionally used to visualize the flow of energy, or materials. . Now to be sure, GTL does have a statement design for a Sankey Diagram which was implemented only in Flex for use

I recently read a Washington Post article about the euro versus the dollar, and I wanted to analyze the data myself to see whether the article was simply stating the facts, or "sensationalizing" things. The washingtonpost.com article started with the headline, "This is historic: The dollar will soon be worth

Did you know the US-Malawi trade relationship is based almost entirely on tobacco? Or that apparel & accessories drive Morocco & Tunisia exports while their North African neighbors rely on oil? The United Nations Statistics Division collects detailed international trade data from more than 200 countries on the import and

Advances in technology, evolution of the distribution channels, demographic shift, economic conditions and regulations changes. How does an insurer prioritize all these seemingly competing goals and create sustainable competitive advantage. One answer is analytics. Many insurance companies are just beginning to take steps toward becoming an “analytic insurer” – one

It may never crossed your mind, but there are real-life cases when reversing graph axes make sense. For example, when Y-axis represents a depth under the sea level or depth of oil well drilling, it makes perfect sense to have zero on top and positive numbers increasing from top down.

Is daylight saving time the ultimate in efficiency, or is it living a lie? Here are some graphs that might help facilitate a discussion on this topic ... With daylight saving time (DST), a whole geo/political area (such as a country) decides to set their clocks forward an hour during
One thing that always puzzled me when starting out with data quality management was just how difficult it was to obtain management buy-in. I've spoken before on this blog of the times I've witnessed considerable financial losses attributed to poor quality met with a shrug of management shoulders in terms