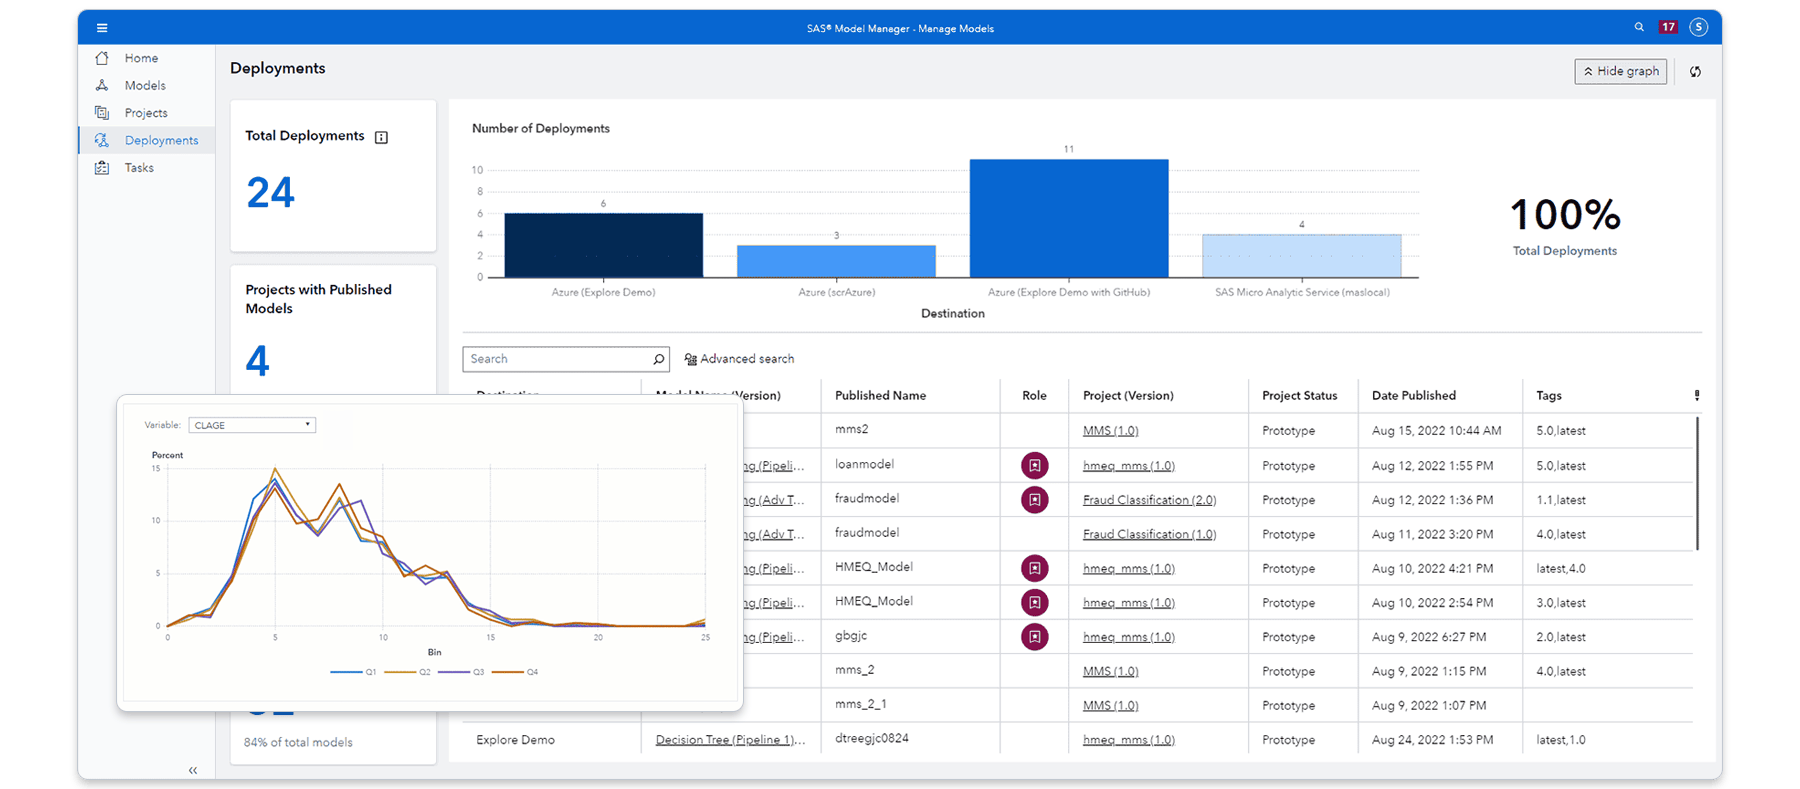
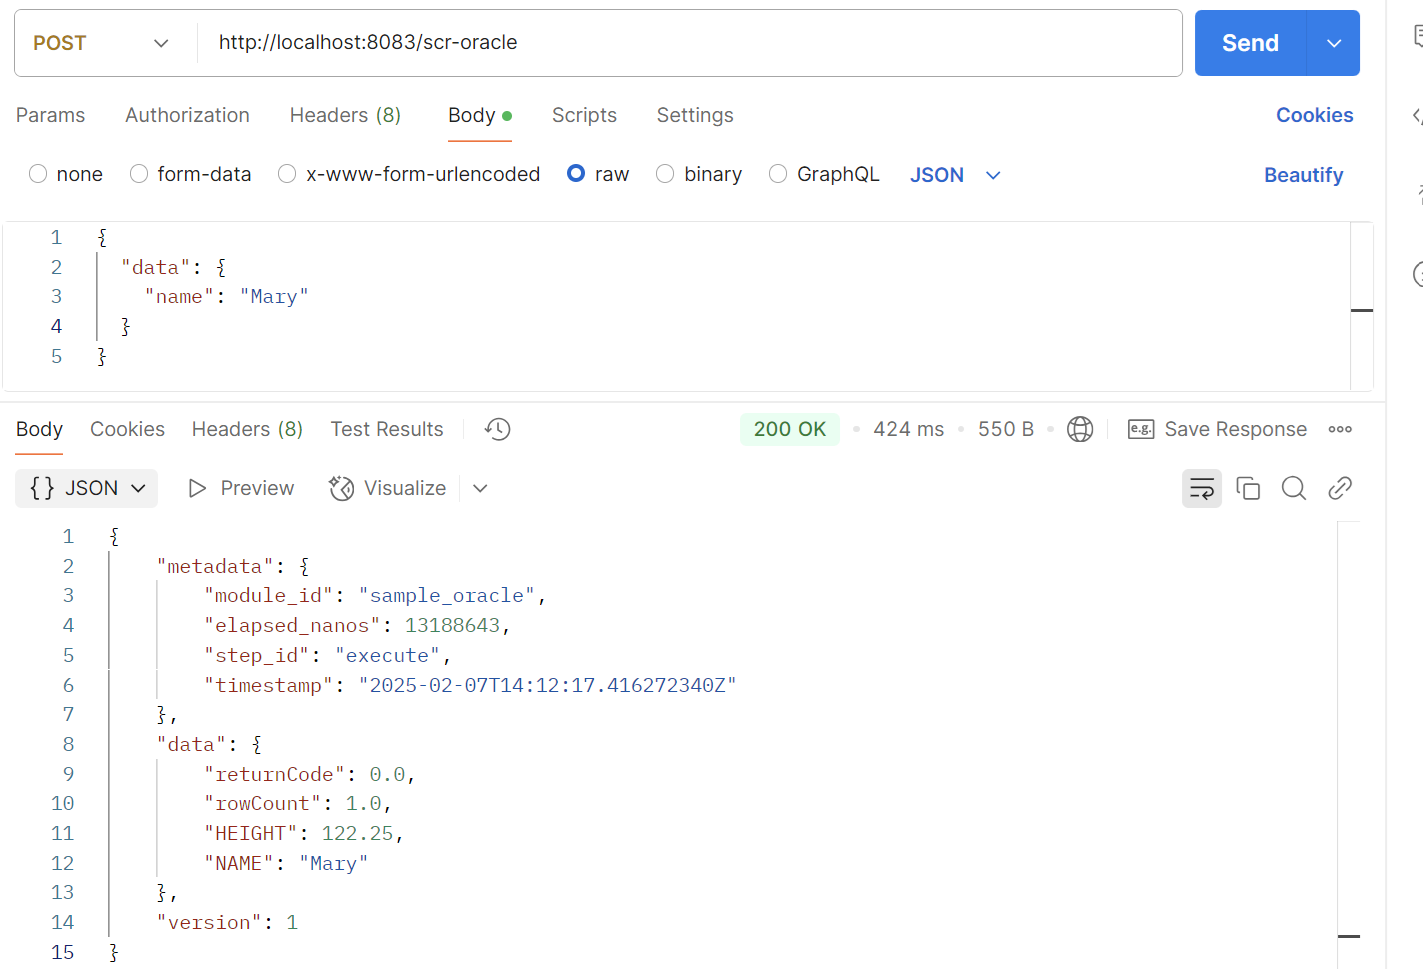
In many movies, there is often a scene where the star says "We can do this the easy way, or the hard way" (and the hard way usually involves quite a bit of pain). So it is with interrogations ... and so it is with writing SAS code! Today I'm
Soccer has been on my mind since the recent tournament in Russia, and fraud is always on my mind. Fighting fraud today means thinking about artificial intelligence (AI) and machine learning (ML). Everyone says so. Like me, you probably wonder how AI and ML work – especially in fraud. What
Recently, Scott Jackson, Director Business Intelligence at the University of North Carolina at Chapel Hill shared their data quality, reporting and analytics journey. They're using SAS in a multitude of ways – from operations, institutional research, athletics – and are now looking to scale to the enterprise. They've been so successful
"When your child 'comes out' to you, thank them. Thank them for loving and trusting you enough to share this important part of themselves with you. They have given you a gift, an opportunity to interact with them in an open and honest way. It means they want your approval
Several weeks ago, I wrote about practical advice from a Chief Data Scientist in my blog “From Aristotle to Pi: Practical advice from a chief data scientist.” Now I want to offer my advice as a newbie trying to navigate through machine learning concepts and how to code them. Over
I started my computer career as a Unix system administrator, and when I began using SAS almost 30 years ago it was only natural that I used it on Unix computers (they were the most powerful/capable computers I had access to at the time). I've picked up a lot of
If you need more than just well-mixed data, take a look at data preparation from SAS.
When you use a regression procedure in SAS that supports variable selection (GLMSELECT or QUANTSELECT), did you know that the procedures automatically produce a macro variable that contains the names of the selected variables? This article provides examples and details. A previous article provides an overview of the 'SELECT' procedures
I can recognize several languages when I hear people speaking them (mostly because I lived in the Alexander International Dorm at NC State University). Therefore when I found a map of the most common languages spoken in each US state, it caught my attention, and I decided to try creating my
A programmer recently asked a question on a SAS discussion forum about design matrices for categorical variables. He had generated a design matrix by using PROC GLMMOD and wanted to use the design columns in a subsequent procedure. However, the columns were named COL1, COL2, COL3,..., so he couldn't tell
@philsimon chimes in about how success in one area can lead to success in another.
As you might have guessed from some of my previous blog posts, I'm an avid paddler. I like to paddle boats, and I like to try to go fast! And when I'm considering buying a new boat, it's only natural that I would analyze the data to make an informed
SAS Visual Analytics includes text parsing actions that can help tokenize sentences, and SAS Visual Text Analytics provides even better, more sophisticated methods. This article contains code samples and cites papers for more details.
You should play a little. Add dots. Add color. Your PROC REPORT output does not have to be boring. As a matter of fact, it can be both functional and appealing. Any Unicode value will do, but this blog shows how to use the Unicode value for a dot (filled
Getting started with SAS Viya and RStudio -- making the connection, and submitting my first commands via CAS actions.
One thing that inspires me is hearing two super minds who are thought leaders in their fields discussing new ways to make our planet better. This happened recently when I listened to an episode of Mark Hyman’s Doctor’s Farmacy Podcast where Dr. Hyman was interviewing environmentalist Miriam Horn. Miriam Horn
Back in SAS 9.3M2 (SAS/STAT 12.1), PROC FREQ introduced mosaic plots to visualize the joint frequencies in a contingency table. By default, the cells in a mosaic plot are colored according to levels of one of the categorical variables in the analysis. However, in 2013 I showed how you can
In SAS Visual Analytics 8.3, a Data View is a reusable and shareable template for a data source. That means that the data view is tied to the data source, and not to the report. Here's how to use them.
Wondering what makes this conference special? Over the years I’ve heard from many attendees that it’s the best way to get the most out of their analytics investments. Analytics Experience is a learning-focused conference featuring networking opportunities, training, certification exams and analytics presentations for all skill levels. #AnalyticsX will give you
When you were a kid, were you intrigued by the 99-cent X-ray glasses advertised in the back of the comic books? If you ordered those glasses, you were probably disappointed. Now that you're an adult, how would you like to use computer techniques to "X-ray" your data and look for
QPR stands for Question, Persuade, and Refer. This is a suicide prevention training that is taught to individuals, teams, and organizations across the world. This training is applicable for the support of family and friends of all ages. Avoiding the topic of suicide when someone is in crisis can have harmful
The headline from the Newark Star-Ledger tells the story: “N.J. drug overdose deaths in 2018 on a record-shattering pace.” The opioid crisis continues to grow in New Jersey. From July 1, 2016 to June 30, 2017, the state saw a 34.7 percent increase in the number of opioid-related deaths, a
Since the late 1990s, SAS has supplied macros for basic bootstrap and jackknife analyses. This article provides an example that shows how to use the %BOOT and %BOOTCI macros. The %BOOT macro generates a bootstrap distribution and computes basic statistics about the bootstrap distribution, including estimates of bias, standard error,
Of course you know how to create graphs ... But do you often find that preparing the data to plot is often the hardest part? Well then, this blog post is for you! I'll be demonstrating how to import Excel data into SAS, transpose the data, use what were formerly column
"Code golf" is a fun programming pastime that challenges you to solve a problem with the least amount of code possible. Like regular golf, the goal is to use fewest code "strokes" to hit the mark. Here's a recent challenge that was posted to me via Twitter. @cjdinger @SASJedi got
Joyce Norris-Montanari shares tips to help those who are still working to address GDPR requirements.
Which character variables have the highest frequency count? You can easily determine this using a variety of procedures that calculate frequency count. For example, the FREQ Procedure or the MEANS Procedure. This blog post illustrates this process through two examples.
See how to sample unstructured (text) data using SAS Viya and CAS actions. This post includes complete code to cluster the text documents via k-means, and treats the cluster memberships as strata for analysis.
This article shows how to implement balanced bootstrap sampling in SAS. The basic bootstrap samples with replacement from the original data (N observations) to obtain B new samples. This is called "uniform" resampling because each observation has a uniform probability of 1/N of being selected at each step of the
SAS batch jobs can generate many log files that accumulate over time. In this post, we present a SAS program that cleans up old log files on your system.