 Have you heard? The ODS Destination for PowerPoint Has a New Option
It’s true. The ODS destination for PowerPoint now has the STARTPAGE= option, which provides you with greater control and flexibility when creating presentations.
Added to the ODS POWERPOINT statement in SAS® 9.4TS1M4, the STARTPAGE= option enables you to force the creation of a new slide between procedures and between ODS layout containers. Inserting a slide break between layout containers is one of the most impactful ways that you can use this option.
A new layout container does not automatically trigger a new slide within the presentation. A new slide is started when the current slide is full. That is the default, but the new STARTPAGE= option gives you the ability to start a new slide between containers even if the current slide is not full.
Examples
Shown below are four procedures placed within three layout containers.
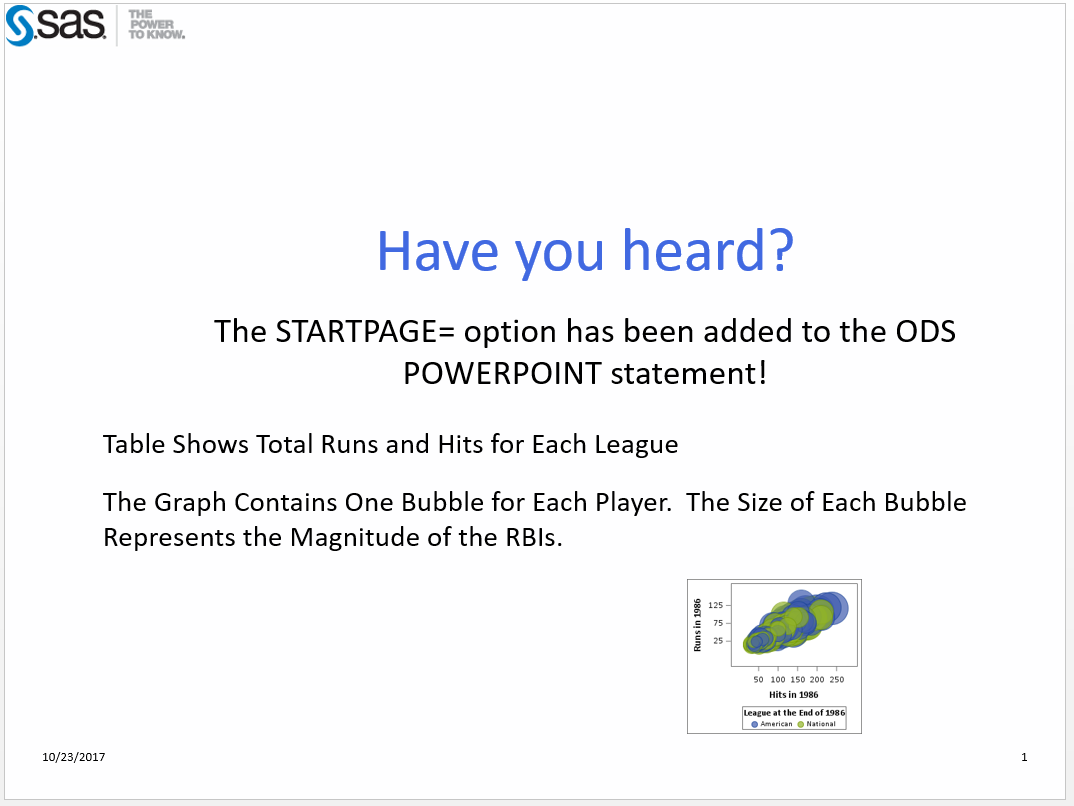
- The first PROC ODSTEXT step is placed in the first layout container. Its purpose is to generate a slide of text, with that text roughly centered in the slide.
- The second PROC ODSTEXT step is in the second container. Its purpose is to provide useful information about the table and graph.
- The PROC TABULATE and SGPLOT steps make up the third container. They are the results of the analysis and, as such, need to be displayed side by side.
Default Behavior of ODS POWERPOINT, Without STARTPAGE=
Let’s look at the default behavior. In this example, the STARTPAGE= option is not used.
ods powerpoint file='example1.pptx' options(backgroundimage="saslogo_pptx.png"); title; ods layout gridded x=10% y=25%; proc odstext; p "Have you heard?" /style=[just=c fontsize=42pt color=RoyalBlue]; p "The STARTPAGE= option has been added to the ODS POWERPOINT statement!" /style=[just=c fontsize=24pt]; run; ods layout end; ods layout gridded rows=1 columns=1; ods region; proc odstext; p 'Table Shows Total Runs and Hits for Each League'; p 'The Graph Contains One Bubble for Each Player. The Size of Each Bubble Represents the Magnitude of the RBIs.'; run; ods layout end; ods graphics / width=4.5in height=4in; ods layout gridded columns=2 column_widths=(47% 47%) column_gutter=1pct; ods region; proc tabulate data=sashelp.baseball; class league; var nruns nhits nrbi; tables league='', sum='Totals'*(nruns nhits)*f=comma12.; run; ods region; proc sgplot data=sashelp.baseball; bubble x=nhits y=nruns size=nrbi/ group=league transparency=.3; run; ods layout end; ods powerpoint close; |
Here is the resulting slide output:
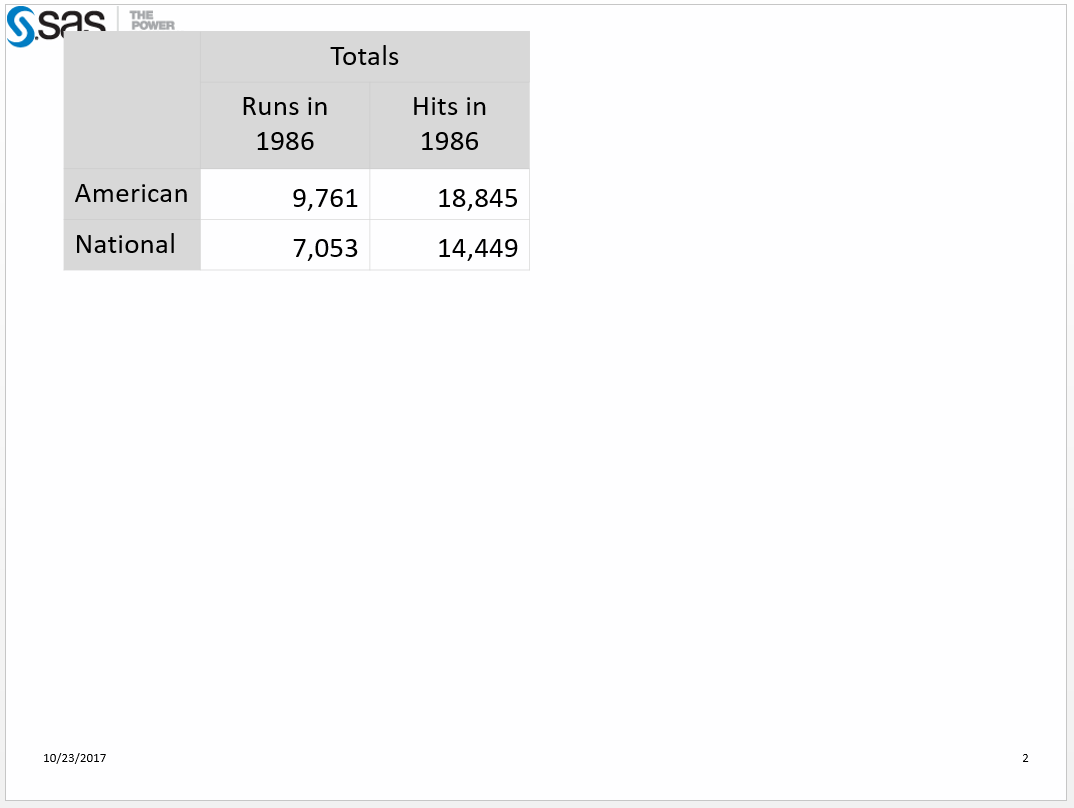
Those results are not what we hoped they would be. The output from the second PROC ODSTEXT step, which is to provide information about the table and graph, is on the first slide. So is the graph!!! And the graph does not look good because it is the wrong size. The table is by itself on the second slide. This is not the desired output at all.
Here Is Where STARTPAGE= Helps!
In this example, an ODS POWERPOINT statement with the STARTPAGE= option is added. It is placed after the ODS LAYOUT END statement for the first container.
ods powerpoint file='example2.pptx' options(backgroundimage="saslogo_pptx.png"); title; ods layout gridded x=10% y=25%; proc odstext; p "Have you heard?" /style=[just=c fontsize=42pt color=RoyalBlue]; p "The STARTPAGE= option has been added to the ODS POWERPOINT statement!" /style=[just=c fontsize=24pt]; run; ods layout end; ods powerpoint startpage=now; /* <---- Triggers a new slide */ ods layout gridded rows=1 columns=1; ods region; proc odstext; p 'Table Shows Total Runs and Hits for Each League'; p 'The Graph Contains One Bubble for Each Player. The Size of Each Bubble Represents the Magnitude of the RBIs.'; run; ods layout end; ods graphics / width=4.5in height=4in; ods layout gridded columns=2 column_widths=(47% 47%) column_gutter=1pct; ods region; proc tabulate data=sashelp.baseball; class league; var nruns nhits nrbi; tables league='', sum='Totals'*(nruns nhits)*f=comma12.; run; ods region; proc sgplot data=sashelp.baseball; bubble x=nhits y=nruns size=nrbi/ group=league transparency=.3; run; ods layout end; ods powerpoint close; |
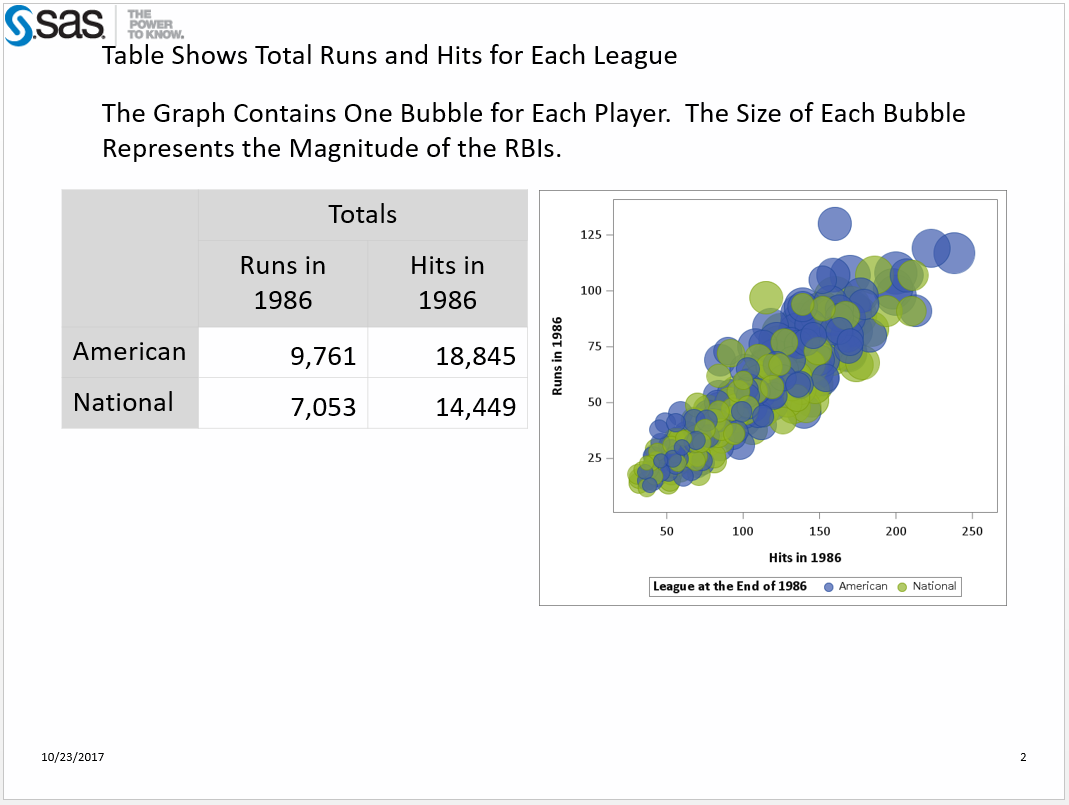
The STARTPAGE= option gave us exactly what we need. The first slide contains just the text (from the first layout container). The second slide contains more text along with the table and graph (from the second and third layout containers).
Use It Wisely!
The most important thing to know about using the STARTPAGE= option with layout containers is that it has to be placed between containers. It cannot be placed within a container. So you cannot put the statement between the ODS LAYOUT GRIDDED and ODS LAYOUT END statements.
For more information about ODS destination for PowerPoint and all of its options, visit this ODS POWERPOINT Statement page in the SAS® 9.4 Output Delivery System: User’s Guide, Fifth Edition.
Note: The portion of the example that uses the SASHELP.BASEBALL data set was taken from the SAS Global Forum 2016 paper, The Dynamic Duo: ODS Layout and the ODS Destination for PowerPoint. Take a peek at it for more examples of using ODS Layout with the ODS destination for PowerPoint.

4 Comments
Hi Jane,
I've just started playing around with the ODS PowerPoint destination. Can you point me in the right direction regarding documentation to edit/create my own style template? I need to create some PowerPoint output that matches our corporate branding so I need to override much of the default PowerPointLight style. I'm struggling with identifying what in the Template is controlling the style for the output. For example, I need to change the PresentationTitle style but I'm not sure what in the Parent = styles.powerpointlight template determines that style. I would rather create my own template based on the powerpointlight template versus editing the style directly in the p 'Presentation Style' / Style = PresentionTitle; statement, since I plan to reuse the style template I'm creating in several different projects that generate PowerPoint output. So my goal is to create a template that matches our corporate branding/style that can be leveraged by several different projects and I'm trying to do that in a way that's also easily maintainable for when changes need to be made. I'm running on SAS 9.4 I think maintenance release 4.
Thanks for the help!
-Andrew
Hi Andrew,
I agree with your assessment that you should make a many style specification within a template as you can. Leave the overrides to specific circumstances.
I would start by looking through these two papers.
A First Look at the ODS Destination for PowerPoint
A Second Look at the ODS Destination for PowerPoint
At the end of the second one you will see the whole PROC TEMPLATE step that generates the PowerPointLight style. You will see the PresentationTitle style element, which you can change to use whatever attributes you want. You can copy that and make the appropriate changes and create you own style from scratch or take the elements you need to modify the PowerPointLight style.
Jane
Hi Jane, is the ods powerpoint startpage=now retired? I ask because when I try including it to get a new slide I get a syntax error, even trying to run the example above.
Hi,
Which version of SAS are running. The STARTPAGE= option was added to the ODS POWERPOINT statement at 9.4TS1M4. If you are running an earlier release of SAS you will get an error. You can check the version by submitting %put &sysvlong; and looking for the number of the M.
If you are running 9.4TS1M4 or M5 and are getting an error please open a track with Technical Support by emailing the log to support@sas.com.
Jane