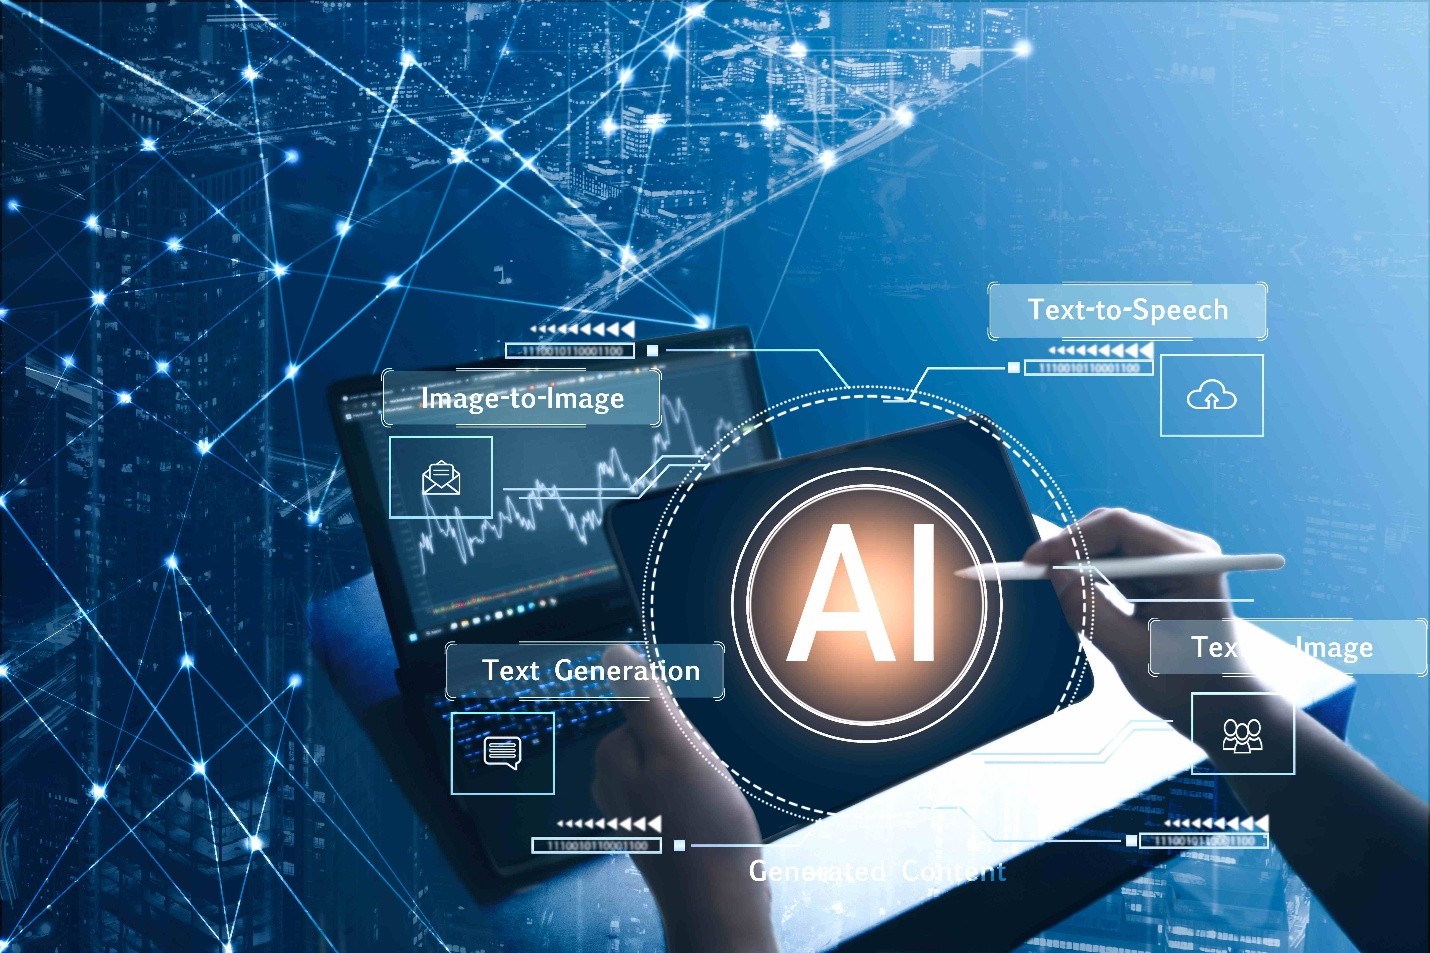
Travel

Data Visualization | Learn SAS | Programming Tips
Sanjay Matange 0
A Graphical Journey

The ODS Graphics software, first released with SAS 9.2, supported creating graphs directly from statistical procedures.  Prior to this, very few statistical procedures created graphs on their own, and in most cases creating graphs was a post process or creating the graphs from the saved data using SAS/GRAPH procedures. With

Data Visualization | Learn SAS | Programming Tips
Sanjay Matange 0
The SGPIE Procedure - Part 2

The SAS 9.4M6 software includes a new SGPIE procedure (preproduction) as introduced in the recent article - The SGPIE Procedure.  In that article, I described the basic features of the two statements supported in the procedure, the PIE and the DONUT, with some examples. It is my humble opinion that

Analytics | Data Visualization | Programming Tips
Robert Allison 0
Hurricane Florence: rainfall totals in the Carolinas

"We been through every kind of rain there is. Little bitty stingin' rain, and big ol' fat rain, rain that flew in sideways, and sometimes rain even seemed to come straight up from underneath." Was that a quote from the Forrest Gump movie, or something said regarding Hurricane Florence? Could be either one! Hurricane Florence recently came through

Advanced Analytics | Analytics
Mauricio González 0
Cómo la analítica equilibra precios competitivos y permite rentabilidad sana

Todo se basa en una sencilla teoría económica: cuando los precios de los productos aumentan, la gente no está dispuesta a pagarlos y, en consecuencia, la demanda se va a pique; evidentemente, sucede el efecto contrario cuando se reducen. No obstante, el mecanismo que se activa al modificar dicho valor

Data Visualization | Learn SAS | Programming Tips
Sanjay Matange 0
Long category values

The South East SAS Users Group meeting wound up yesterday.  The 25th anniversary conference was held on SAS Campus and it provided a great opportunity to meet with many enthusiastic SAS users and attend many informative presentations.  More on this in a follow-up article. During one of these presentations, Mary

Data Visualization | Learn SAS | Programming Tips
Sanjay Matange 0
Tips and tricks - Multiple blank categories on axis

Off and on, users have expressed the need to include multiple blank categories on a discrete axis.  Often, this is desirable to separate groups of bars (or categories) in a graph due to some difference their definition.  Such a case was discussed in this blog article on using non breaking

Data Visualization | Learn SAS | Programming Tips
Sanjay Matange 0
New Features in SAS 9.40M5 - Gradient fills

ODS Graphics procedures primarily strive towards the following goal:  "Make simple graphs easy and complex graphs possible".   SGPLOT procedure allows you create simple graphs with a single plot statement, and create complex graphs by layering together or combining multiple plot statements.  Generally, the appearance follows the guidelines set by industry

Data Visualization | Learn SAS | Programming Tips
Sanjay Matange 0
New features with SAS 9.40 M5

SAS 9.4 maintenance release 5 was released on Sept 19, 2017.  This release includes many new items including integration with SAS Viya and SAS Studio, a web application for SAS development.  Also Included with this release are some cool new features in the graphics domain, some of which were requested