During one week in December, two separate transportation agencies within the federal government made two major announcements. First, the National Highway Traffic Safety Administration (NHTSA) – the government agency responsible for guiding traffic safety initiatives on the nation’s highways announced that crash fatalities had declined to record low rates. Just
Uncategorized
A recent post on the SAS website shows the SAS Annual Revenue History. It would be interesting to see how we could create such a graph using SG procedures, and how we could add more information and interest in the presentation. So, I started with the basic informaiton on the annual revenues provided,
In the R programming language, you can use a negative index in order to exclude an element from a list or a row from a matrix. For example, the syntax x[-1] means "all elements of x except for the first." In general, if v is a vector of indices to
Following up on the theme of graphs commonly used in many applications, here is another one that displays a horizontal bar chart with multiple data columns aligned with the bars. Recently at WUSS, a user stopped by asking how to create just such a graph. While this user wanted something more complex
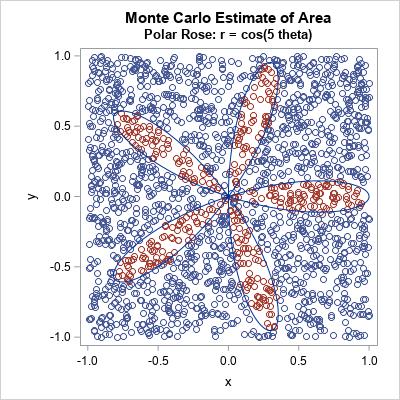
Buffon's needle experiment for estimating π is a classical example of using an experiment (or a simulation) to estimate a probability. This example is presented in many books on statistical simulation and is famous enough that Brian Ripley in his book Stochastic Simulation states that the problem is "well known
In the immortal words of Britney Spears: Oops! I did it again. At least, I'm afraid that I did. I think I might have helped a SAS student with a homework assignment, or perhaps provided an answer in preparation for a SAS certification exam. Or maybe it was a legitimate
Local governments are not immune to the rising demand for more accountability in government run services and programs, and the expenditure of public funds. Elected officials and citizens alike want to know what these programs accomplish for the public investment made. To date, the response to these questions and demands has been
Let us ring in the new year with something simple and useful. A recent question by a user over the holidays motivated this article on what is likely a commonly used graph. We want to compare the preformance of two categories along with a third measure. This could be something like "How
Hello, 2012! It's a New Year and I'm flushed with ideas for new blog articles. (You can also read about The DO Loop's most popular posts of 2011.) The fundamental purpose of my blog is to present tips and techniques for writing efficient statistical programs in SAS. I pledge to
At the beginning of 2011, I made four New Year's resolutions for my blog. As the year draws to a close, it's time to see how I did: Resolution: 100 blog posts in 2011: Completed. I blew by this goal by posting 165 articles. I recently compiled a list of
Is there anything you'd like to tell your management? Of course, in the spirit of the holiday season, I mean is there anything you'd like to tell your management that isn't anatomically impossible? If so, please join me and Ryan Rickard, Sr. Supply Chain Manager at Newell Rubbermaid, for our
Ron Cody and his supremely helpful book Learning SAS by Example close out our weekly SAS Author's Tip of 2011. Ron Cody is a household name in the SAS user community. And he deserves the moniker on his license plate of "SASMAN". Just mentioning Ron's name at user conferences incites awe. Sometimes
Lots of the visitors to this blog arrive here by way of Google search (welcome!). Thanks to search engines and a few well placed keywords, the same older posts (let's call them "timeless topics") seem to attract the most traffic from year to year. I hope that the searchers find
2011 saw incredible change in the states as more than half of the governorships changed hands. As expected, that caused significant turnover at the State CIO level, as well. So while executive and technology policies changed in many ways, the dismal budget situation reinforced the need to allocate tax pay
Bad customer service experiences burn into our brains, creating permanent recall. And although we rightfully expect good customer service across the board, truly exceptional customer care is also unforgettable. This month, I featured an interview with SAS Publishing sales representative Sharon Brandon in the new issue of SAS Publishing News.
You’ve got your raw data visualized, you need a graph that shows the results of a custom analysis, you have a mental image of the graph you want to create, but…you don’t know the procedure needed to create what you want. Sanjay Matange and Dan Heath have written a book
In Simple maps can go a long way, we discussed some techniques to create simple outline maps from map datasets in the MAPS library using GTL. Now, let us take this a step further to do something more useful with this feature. For some graphs, the map information is an essential part of the
On the heels of the release of the popular SAS macro variable viewer from last month, I'm providing another custom task that I hope will prove just as useful. This one is a SAS options viewer, similar in concept to the OPTIONS window in SAS display manager. You can download
Managing expectations for forecast accuracy is very important, as often those expectations are extreme after management invests in a new system. Software vendors have also been known to make overly (choose one: optimistic? sanguine? idyllic?) accuracy claims as part of their sales pitch. Of course, there is no arbitrary level of accuracy
A few colleagues and I were exchanging short snippets of SAS code that create Christmas trees and other holiday items by using the SAS DATA step to arrange ASCII characters. For example, the following DATA step (contributed by Udo Sglavo) creates a Christmas tree with ornaments and lights: data _null_;
A new book from SAS Press, "Statistical Graphics Procedures by Example" co-authored by Dan Heath and I has now been published (phew!). For both Dan and I, this was our first foray into writing a book, so it was highly educational to say the least. The key idea behind the presentation
After my November blog post about achievement gaps between affluent and poor students, Newt Gingrich cast some renewed energy on the topic with his inflammatory comments about poor children at a Dec 1st GOP debate. In case you missed his remarks, here is the quote that sent the media into
My daughter's math lessons this year have included the concept of negative numbers (that is, numbers that are less than zero, not numbers that have a bad attitude). She has used number lines such as this one to help her while she completes her homework: Notice that in this number
Since this is a blog about statistical programming and analysis, I am always looking for data to analyze. As 2011 ends, I look back on the 165 blog entries that I published since 01JAN2011. This article presents the 10 most popular posts, as determined by the number of people who
On his SAS and R blog, Ken K. recently posted an example of a visualization technique called "small multiples". In this exercise, Ken shows the programming technique for replicating a particular series of pie charts in R as well as in SAS. It's a useful exercise to learn from, but
SAS Press prides itself on being a place where users come to help other users. Collaboration is key here—not just between authors and the SAS Press team, but among authors alike. So we asked two of our authors, one experienced and one currently working on his first book, to share
My Google Alert on "forecastability" paid off with a gem this weekend, in the blog post "Forecastability and Over Fitting" by Shaun Snapp on SCM Focus. I was not previously familiar with Shaun or this site, but found a lot to like -- in content and attitude. In his post, Shaun kindly
Since joining SAS, I no longer run screaming from social media, blogs, etc. In fact, I embrace exploring different mediums to highlight how SAS is assisting today’s law enforcement. To that end, and in recognition that sometimes less is more, I give you this short intro. SAS continues to push
The SAS Output Delivery System (ODS) enables you to manage and customize tables (and graphics!) that are created by SAS procedures. I like to use the ODS SELECT statement to display only part of the output of a SAS procedure. For example, the UNIVARIATE procedure produces five tables by default,
Some SAS products such as SAS/IML Studio (which is included FREE as part of SAS/IML software) have interactive graphics. This makes it easy to interrogate a graph to determine values of "hidden" variables that might not appear in the graph. For example, in a scatter plot in SAS/IML Studio, you