Following up on the theme of graphs commonly used in many applications, here is another one that displays a horizontal bar chart with multiple data columns aligned with the bars. Recently at WUSS, a user stopped by asking how to create just such a graph. While this user wanted something more complex (we'll get there soon), let us start here.
Using SAS 9.2 GTL, we can create such as graph:
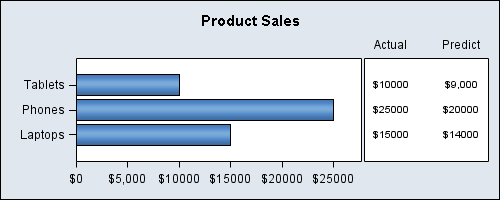
The GTL code for the graph is as follows.
 define statgraph BarStatLattice;
    begingraph;
      entrytitle 'Product Sales';
      layout lattice / rowdatarange=union columns=2 rows=1
                            columnweights=(0.7 0.3)  columngutter=0;
        rowaxes;
          rowaxis / display=(ticks tickvalues);
        endrowaxes;

        layout overlay / xaxisopts=(offsetmax=0.1 display=(ticks tickvalues));
          barchart x=product y=actual / orient=horizontal skin=modern;
        endlayout;

        layout overlay / x2axisopts=(display=(tickvalues));
          scatterplot y=product x=actlabel / markercharacter=actual xaxis=x2;
          scatterplot y=product x=PreLabel / markercharacter=predict xaxis=x2;
        endlayout;

      endlayout;
    endgraph;
  end;
run;

ods listing style=blue;
ods graphics / reset width=5in height=2in imagename='BarStatLattice_GTL';
proc sgrender data=bartable template=BarStatLattice;
  where Region='North';
run; |
In the above example, we have used the following techniques to create this graph:
- We use a LAYOUT DATALATTICE with two columns and weights of 70% and 30%.
- We add a horizontal BARCHART in the first cell with product as category (X).
- We add two scatter plots in the second cell with Y=product using the X2 axis.
- ROWAXES block is used to get single external common row axis.
Note in the PROC SGRENDER step, we have specified a where clause to only display data for "North". The full SAS code is included at the end.
Recall I mentioned that the user at WUSS wanted such a chart, but something more? What he wanted was a panel of such graphs. So let us see what we need to do to take the step to create a panel of bars with the statistics as shown below. Note the two regions "North" and "West" in the graph:
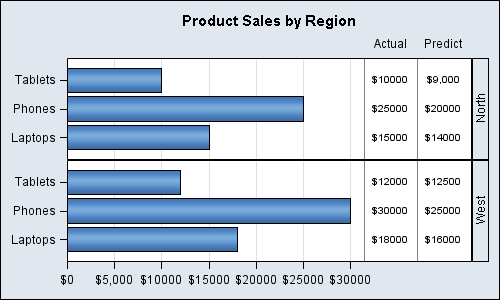
On first thought, it may appear we can simply extend the first graph into a panel using LAYOUT DATALATTICE and ROWVAR=region. However, the graph at the top has two separate cells, and the PROTOTYPE (repeated rubber stamp) for a DATALATTICE can only be a single OVERLAY type cell. We cannot create a PROTOTYPE of two cells, and then have that 2-cell combination repeated for each value of the class variable. Would be nice, but no can do.
Since the above graph is done using GTL, how did I do it? You will notice that each cell of the above graph is not exactly like the first graph. The graph "Bar with Statistics" is a real 2-cell graph (note the small space between the two cells). The graph "Bar Statistics Panel" is a DataLattice. So, it must have only one cell as the prototype.
We create a single cell version of the first graph using a technique to split a single cell into two regions, one controlled by the X axis and one by the X2 axis as described in SGPLOT with axis-aligned statistics columns. While the article uses SGPLOT to do this, you can also do this in GTL. The first region on the left has the bar chart, and the second region on the right has the table created using the scatter plot.
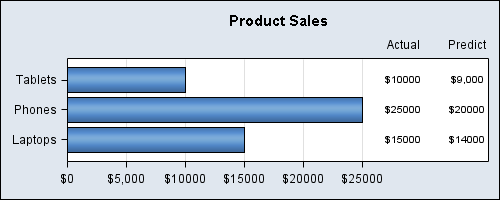
Here is the GTL code. Note we use only one LAYOUT OVERLAY for the whole graph:
proc template; define statgraph BarTable; begingraph; entrytitle 'Product Sales'; layout overlay / xaxisopts=(offsetmin=0 offsetmax=0.3 griddisplay=on display=(ticks tickvalues)) x2axisopts=(offsetmin=0.8 offsetmax=0.05 display=(tickvalues)) yaxisopts=(display=(ticks tickvalues)); barchart x=product y=actual / orient=horizontal skin=modern name='a'; scatterplot y=product x=actlabel / markercharacter=actual xaxis=x2; scatterplot y=product x=PreLabel / markercharacter=predict xaxis=x2; endlayout; endgraph; end; run; |
Now, we can use this single cell as the prototype for the DATALATTICE as shown below to create the graph shown earlier. We added a couple of referencelines to act as separators between the graph and the columns using the DISCRETEOFFSET option. The full SAS code is included in the above link.
proc template; define statgraph BarTablePanel; begingraph; entrytitle 'Product Sales by Region'; layout datalattice rowvar=region / headerlabeldisplay=value columnaxisopts=(offsetmin=0 offsetmax=0.3 griddisplay=on display=(ticks tickvalues)) column2axisopts=(offsetmin=0.8 offsetmax=0.07 display=(tickvalues)) rowaxisopts=(display=(ticks tickvalues)); layout prototype; barchart x=product y=actual / orient=horizontal skin=modern name='a'; scatterplot y=product x=actlabel / markercharacter=actual xaxis=x2; scatterplot y=product x=PreLabel / markercharacter=predict xaxis=x2; referenceline x="Actual" / xaxis=x2 discreteoffset=-0.5; referenceline x="Predict" / xaxis=x2 discreteoffset=-0.5; endlayout; endlayout; endgraph; end; run; |
The full code for all the three graphs above is available here: Full SAS Code
While we only did a ROWLATTICE, we could easily use the same technique to do a COLUMNLATTICE instead or even a full Row x Column data lattice.
The "Blue" style used above is just something I cooked up. This will work equally well with the default styles.


2 Comments
Could GTL be used to force bar charts to use log axis in SGplot?
Bar charts always interpret the categorty data as discrete. With SAS 9.3, we are doing Box Plots on Interval axes (SAS 9.3). So, it is a valid to review this assumptio for a future release. In the meantime, you could use a NEEDLE plot (on interval axis) to simulate a bar chart (assuming you have summarized the data). Or, with SAS 9.3, you could use the HIGHLOW plot with TYPE=BAR. See article on Bar Chart on Interval Axis (http://blogs.sas.com/content/graphicallyspeaking/2012/04/16/bar-chart-on-interval-axis/).