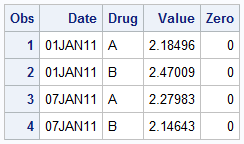
Recently, a user asked about creating a Bar Chart of Value by Date, where the dates are displayed on a scaled interval axis. Consider this simulated data set of value by date and treatment shown below. This data set only has one value for each date and treatment combination.
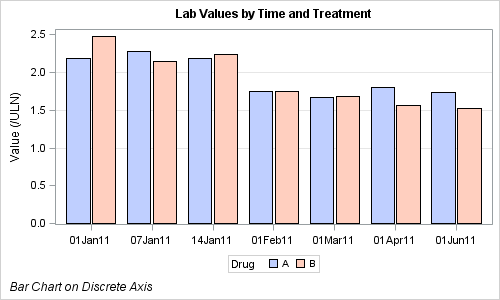
We can use the VBAR statement in SGPLOT procedure to create a bar chart of Value by Date and Treatment. The VBAR statement always treats the category variable as discrete. With SAS 9.3 SGPLOT, we get the following graph:
SAS 9.3 SGPLOT code:
title 'Lab Values by Time and Treatment'; footnote j=l 'Bar Chart on Discrete Axis'; proc sgplot data=Lab_Trt; refline 1 1.5 2 / lineattrs=graphgridlines; vbar date / response=value group=Drug groupdisplay=cluster barwidth=0.9; xaxis discreteorder=data display=(nolabel); yaxis label='Value (/ULN)'; run; |
We have used the VBAR statement with Date as the required variable, Response=Value, Group=Drug and GroupDisplay=Cluster to get the side-by-side placement of the bars for each drug. Note, we have intentionally set BarWidth=0.9 to get a small gap between the treatment values. As expected, the dates are positioned as discrete values, and the time scaling is lost.
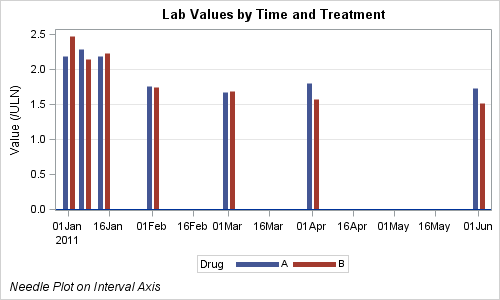
How can we create a bar chart where the X axis values are displayed on a scale of time, and not as discrete values? With SAS 9.3, you can use the Needle plot, which will treat the X axis as interval data. Setting line thickness=5 pixels, we get this graph:
SAS 9.3 SGPLOT code:
title 'Lab Values by Time and Treatment'; footnote j=l 'Bar Chart on Discrete Axis'; proc sgplot data=Lab_Trt; refline 1 1.5 2 / lineattrs=graphgridlines; needle x=date y=value / group=Drug groupdisplay=cluster lineattrs=(thickness=5); xaxis discreteorder=data display=(nolabel); yaxis label='Value (/ULN)'; run; |
In this graph, we have used the Needle plot with X=Date, Y=Value, Group=Drug, and GroupDisplay=Cluster. This creates the above graph, where the X axis is displayed as a scaled time axis, and each treatment is displayed side-by-side. The default needle thickness in 1 pixel, so we have to guess at a good thickness value. In this case, 5 pixels seems to work, however, this is just a guess, and not scalable.
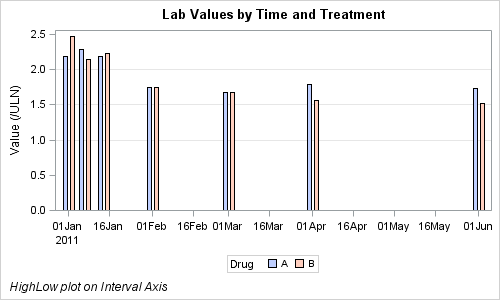
Another way is to use the new HighLow plot included with the SAS 9.3 release of the SGPLOT procedure. Here is the graph:
SAS 9.3 SGPLOT code:
title 'Lab Values by Time and Treatment'; footnote j=l 'HighLow plot on Interval Axis'; proc sgplot data=Lab_Trt; refline 1 1.5 2 / lineattrs=graphgridlines; ; highlow x=date high=value low=zero / type=bar group=Drug groupdisplay=cluster lineattrs=(color=black); xaxis discreteorder=data display=(nolabel); yaxis label='Value (/ULN)' offsetmin=0; run; |
In the code above, we have used the HighLow plot and set the X=Date, High=Value, Low=Zero, a variable in the data that has zero value. We have set Group=Drug, GroupDisplay=Cluster and Type=Bar. All together, this creates a bar chart we are looking for.
The benefits of using the HighLow plot instead of Needle are:
- Each bar looks like a "bar" with filled and outline color.
- The width of each bar is automatically computed based on the minimum distance between the bars.
Full SAS 9.3 code: Full SAS 93 SG Code


1 Comment
Great post Sanjay! I always wondered what the Needle statement did.