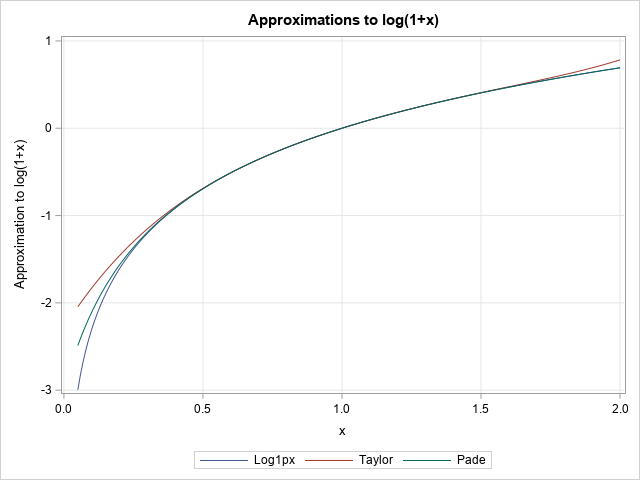
SAS Community member @tc (a.k.a. Ted Conway) has found a new toy: ODS Graphics. Using PROC SGPLOT and GTL (Graph Template Language), along with some creative data prep steps, Ted has created several fun examples that show off what you can do with a bit of creativity, some math knowledge,
Uncategorized
Actualmente, a nivel mundial los deportes generan ganancias estratosféricas, desde las propias entradas a los eventos y/o torneos, los múltiples contratos televisivos, patrocinios, souvenirs, hasta las marcas de ropa y calzado deportivo que han hecho de esta vertical de negocio una de las más rentables en los últimos tiempos. La
.@philsimon says that even seemingly useless information can be useful under the right circumstances.
What would happen if we could ask any type of scientific or clinical question about patients, and then go out and find the data to answer our questions? With "real-world data," we can do just that. Real-world data is all medicinal product data that comes from real-life patients. In contrast,
Many people have the perception that data governance is all about policies and mandates, committees and paperwork, without any real "rubber on the road" impact. I want to dispel this viewpoint by sharing a simple example of how one company implemented data governance to enforce something practical that delivered long-term
Every year near Halloween I write an article in which I demonstrate a simple programming trick that is a real treat to use. This year's trick (which features the CMISS function and the crossproducts matrix in SAS/IML) enables you to count the number of observations that are missing for pairs
Halloween appears to be my favorite holiday, because I seem to have more graphs related to it than any of the others. And since Halloween is just a few days away, I thought you might like an easy way to see all those graphs. Here's are links to my previous Halloween-related blog
In my prior posts about operational data governance, I've suggested the need to embed data validation as an integral component of any data integration application. In my last post, we looked at an example of using a data quality audit report to ensure fidelity of the data integration processes for
I've been reflecting on my life and career recently and was amazed to discover that I just hit 30 years of working with industrial and manufacturing applications. While it’s a bit tough to admit my age, I’m quite happy with my career and have enjoyed manufacturing and industrial applications. I
Kennen Sie diese Situation? Sie sollen dringend eine komplexe Auswertung fertig stellen. Die Daten wurden zu spät geliefert und die Qualität und Struktur der Daten waren weit vom erwarteten Standard entfernt. Der Zeitdruck der Ergebnispräsentation ist groß, und Ihr SAS Programm tut immer noch nicht genau das, was Sie als
Aphorism 6: The Surest Way to Get a Better Forecast is to Make the Demand Forecastable Forecast accuracy is largely dependent on volatility of demand, and demand variation is affected by our own organizational policies and practices. So an underused yet highly effective solution to the forecasting problem can be
Consumers want content 24 hours a day, seven days a week, all around the world. It's a tall order for media & entertainment (M&E) companies and a 180 degree shift from days past. How do they provide enough content to meet demand? Audiences are binge watching over-the-top (OTT) programming, creating
Like unexpectedly seeing this beautiful bird in nature, SAS has tons of free goodies you might be surprised to encounter as you explore your software. A user asked me how to find products licensed at their workplace and that's how this informative blog got started. While individual organizations may have
Aphorism 3: Organizational Policies and Politics Can Have a Significant Impact on Forecasting Effectiveness We just saw how demand volatility reduces forecastability. Yet our sales, marketing, and financial incentives are usually designed to add volatility. We reward sales spikes and record weeks, rather than smooth, stable, predictable growth. The forecast
In seinem Buch „Competing on Analytics“ benennt Tom Davenport die Analytik als Grundlage nachhaltiger Wettbewerbsvorteile. Der Grund dafür ist der prädiktive Ansatz. Heutzutage ist es nicht mehr möglich, ein Unternehmen alleine mit Blick in den Rückspiegel zum Erfolg zu führen. Und Analytik erlaubt den dringend erforderlichen Blick in die Zukunft.
When simulating data or testing algorithms, it is useful to be able to generate patterns of missing data. This article shows how to generate random and systematic patterns of missing values. In other words, this article shows how to replace nonmissing data with missing data. Generate a random pattern of
The State Fair in North Carolina is just a few miles from SAS headquarters, and therefore it's virtually impossible for it to slip by without me noticing it. There are two aspects of the fair that usually get lots of news coverage - what's the latest fair-food, and did we
.@philsimon says that data-governance professionals will need to be more agile than ever.
SAS Enterprise Guide has come a long way since version 1.0 was released in 1999! Are any of you original users that remember the Help characters, Clippy, Peedy or Merlin? I was working as a statistician for another company that year, and I attended a SAS user group meeting where
The Aphorisms of the New Defensive Paradigm I want to finish this blog series with a set of 7 aphorisms – concise statements of principle – that characterize the new Defensive paradigm for business forecasting. The first is that: Aphorism 1: Forecasting is a Huge Waste of Management Time This
Analytics provides better insights into why something happened, or helps provide decision makers with information about what will happen in the future. That allows organizations to act now to improve outcomes instead of reacting to events after they happen. But it takes more than analytics alone. Achieving this level of
Living to 100 isn't as simple as just paying a certain amount of money for your healthcare. But that is an interesting aspect of longevity, so let's have a look at the data ... In my previous blog post, we analyzed how much people from various countries spend on healthcare.
Academic Research In an approach akin to FVA analysis, Paul Goodwin and Robert Fildes published a frequently cited study of four supply chain companies and 60,000 actual forecasts.* They found that 75% of the time an analyst adjusted the statistical forecast. They were trying to figure out, like FVA does,
I've written several articles about scatter plot smoothers: nonparametric regression curves that reveal small- and large-scale features of a response variable as a function of an explanatory variable. However, there is another kind of "smoothness" that you might care about, and that is the apparent smoothness of curves and markers
Typical Business Forecasting Process Let’s look at a typical business forecasting process. Historical data is fed into forecasting software which generates the "statistical" forecast. An analyst can review and override the forecast, which then goes into a more elaborate collaborative or consensus process for further adjustment. Many organizations also have
In recent healthcare blogs I’ve looked at the need to drive more value from the UK’s National Health Service (NHS) and how this relies upon the ability to make decisions based on robust, data-driven insights. But what value will these decisions have if they're not founded on a mature data
As an instructor for SAS, I receive a wide variety of queries before, during and after delivering my courses. Most frequently, I am asked questions such as: Should I learn SAS programming or a point and click tool instead? I know lots of code, should I go straight to the
Data governance plays an integral role in many enterprise information initiatives, such as data quality, master data management and analytics. It requires coordinating a complex combination of factors, including executive sponsorship, funding, decision rights, arbitration of conflicting priorities, policy definition, policy implementation, data stewardship and change management. With so much overhead involved in
The Means of the Defensive Paradigm The Defensive paradigm pursues its objective by identifying and eliminating forecasting process waste. (Waste is defined as efforts that are failing to make the forecast more accurate and less biased, or are even making the forecast worse.) In this context, it may seem ridiculous
The study of social networks has gained importance over the years within social and behavioral research on HIV and AIDS. Social network research can show routes of potential viral transfer, and be used to understand the influence of peer norms and practices on the risk behaviors of individuals. This example analyzes the