 SAS Community member @tc (a.k.a. Ted Conway) has found a new toy: ODS Graphics. Using PROC SGPLOT and GTL (Graph Template Language), along with some creative data prep steps, Ted has created several fun examples that show off what you can do with a bit of creativity, some math knowledge, and open data.
And bonus -- since most of his examples work with SAS OnDemand for Academics, it's easy for you to try them yourself. Here are some of my favorites.
Learn to draw a Jack-O-Lantern
Using the GIF output device and free data from Math-Aids.com, Ted shows how to use GTL (PROC TEMPLATE and PROC SGRENDER) to animate this Halloween icon.
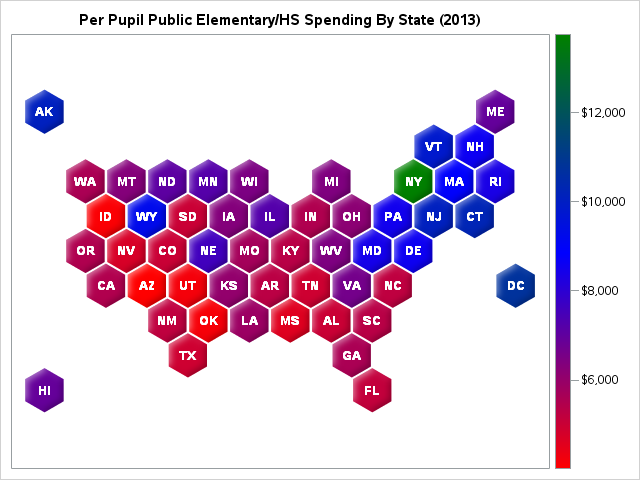
The United Polygons of America
Usually map charts with SAS require specialized procedures and map data, but here's a technique that can plot a stylized version of the USA and convey some interesting data. (You might have seen this one featured in a SAS Tech Report newsletter. Do you subscribe?)
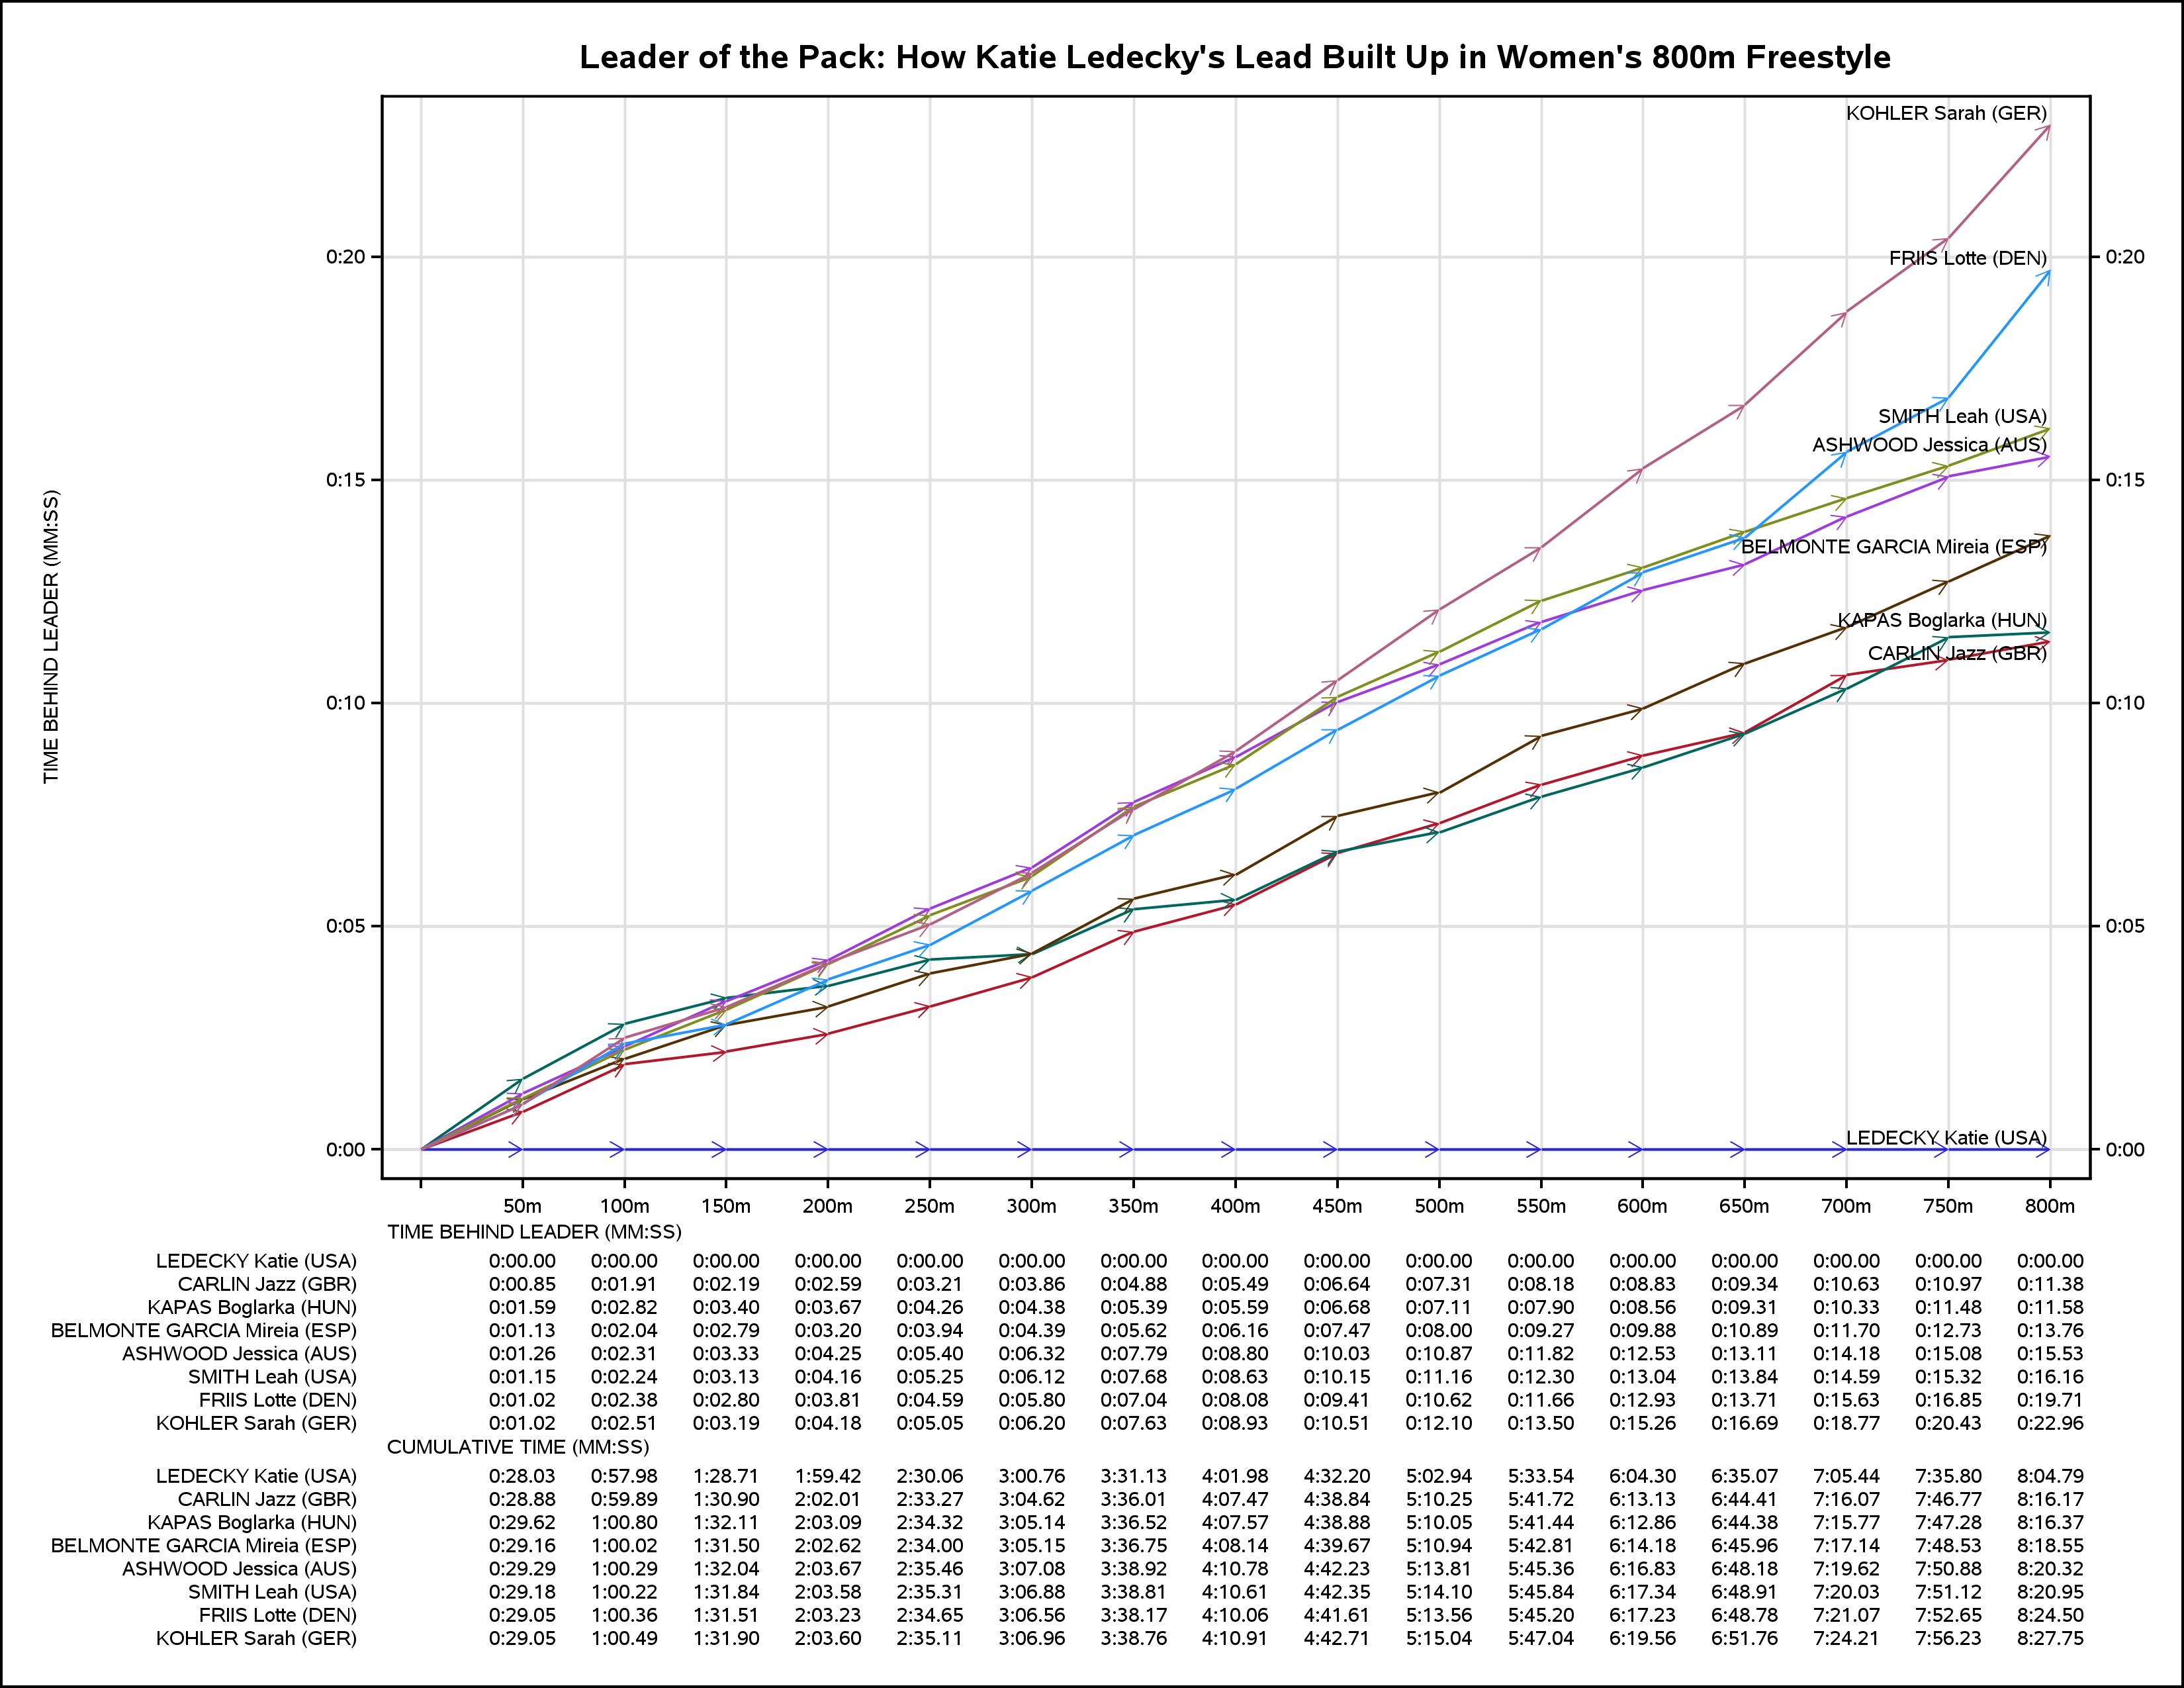
A look at Katie Ledecky's dominance
Using a vector plot, Ted shows how this championship swimmer dominated her event during the summer games in Rio. This example contains a lot of text information too; and that's a cool trick in PROC SGPLOT with the AXISTABLE statement. Click on the image for a closer look.
Demonstrating the Bublé Sort
This example is nerdy on so many levels. It's a take on the Computer Science 101 concept of "bubble sort," an algorithm for placing a collection of items in a desired order. In this case, the items consist of Christmas songs recorded by Michael Bublé, that dreamy crooner from Canada.
Ted posts these examples (and more) in the SAS/GRAPH and ODS Graphics section of SAS Support Communities. That's a great place to learn SAS graphing techniques, from simple to advanced, and to see what other practitioners are doing. Experts like Ted hang out there, and the SAS visualization developers often post answers to the tricky questions.
More from @tc
In addition to his community posts, Ted is an award-winning contributor to SAS Global Forum with some very popular presentations. Here are a few of his papers.

5 Comments
I'm a HUGE fan of Ted's creativity and SAStastic data visualizations. Love them... thanks for sharing them in a blog post Chris.
Love the SAS Global Forum 2016 promo video he did too... https://www.youtube.com/watch?v=RL1TzDr_Uno
See other videos on his YouTube channel - https://www.youtube.com/channel/UCrBQlJWuMZhwpAx2P4QDyAQ
For a while, Ted had the best SAS blog (The Unofficial SAS Weblog).
http://www2.sas.com/proceedings/sugi31/134-31.pdf
https://groups.google.com/forum/m/#!topic/comp.soft-sys.sas/hSdr9rJJDFM
You can still find it at the web archive:
https://web.archive.org/web/*/http://sas.weblogsinc.com/
That's right! Ted wrapped it up just as I was getting my own blogging career started -- no connection between those events, I'm sure!
I just went spelunking into the web archive and found link from Ted's blog to the SAS Technology Report, a.k.a. SAS Tech Report. Shelley Sessoms was editor of that before she moved to SAS Press. Today, Shelley works in my group on communities.sas.com (where Ted contributes), and I put together one of the twice-monthly editions of Tech Report.
This shows why I prefer to teach SAS programming and not EG, If you are a skilled and creative programmer, the sky's the limit. How creative can you be with EG?
Jim, let's not equate "using EG" with "non-programming". Many of the customers I talk to are SAS programmers who use EG as a programming environment, while sometimes relying on point-and-click tasks to bootstrap their projects. I've recreated (re-run) Ted's examples in this post using EG. Ted created them using SAS Studio -- another client application that mixes programming and tasks. And now with program history, Git integration, and a DATA step debugger -- EG is as a formidable SAS programming environment as any app.