All Posts


Have you registered for the 20th annual SouthEast SAS Users Group conference (SESUG) yet? NO? What are you waiting for? I've heard it going to be a real party, so come help us celebrate SESUG's 20th birthday (hmm ... SESUG isn't even old enough to drink). The last time I went was


Sunny days, keeping the clouds away, can you tell me how to get, how to get to Sesame Street?? Oops, sorry, was just day dreaming about younger days and the magic of an eight foot talking yellow bird. How great was Sesame Street? I learned counting, my abc’s, sharing, diversity,
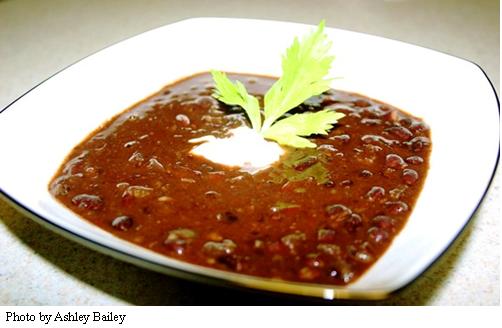

Beans aren’t just good for your heart; they’re affordable, convenient, and packed with nutrients that have a wide range of health benefits including lowered LDL cholesterol, blood sugar control, weight management, and more. Beans are an excellent plant-based source of protein and fiber and are rich in minerals such as
~ Lisa Pyle and Rob Russell, NESUG 2012 Conference Co-chairs Can you believe it?! In just a few weeks we will all be together at NESUG's 25th conference! We are looking forward to all the presentations and workshops we have planned and to seeing all our old friends and meeting some new ones too.
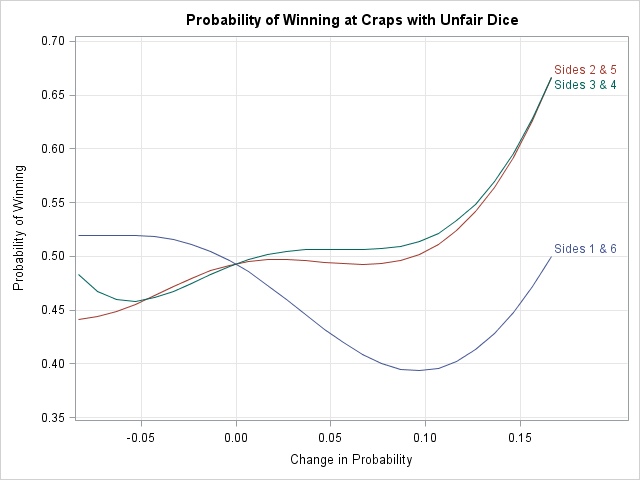

Last week I wrote a SAS/IML program that computes the odds of winning the game of craps. I noted that the program remains valid even if the dice are not fair. For convenience, here is a SAS/IML function that computes the probability of winning at craps, given the probability vector


You might know about the many automatic macro variables that are available in SAS. They provide plenty of information about the SAS environment, such as the current user (SYSUSERID), the SAS version (SYSVER and SASVLONG), and the operating system where SAS is running (SYSCP and SYSCPL). That information is often

As SLG’s health policy specialist, I’m chartered with developing novel ways to apply data analytics to our state government health systems. If you ask me, it’s the perfect blend of technology and policy - two of my favorite things. However, I sometimes find it challenging to identify the areas within

The Scatter Plot Matrix statement supports a couple of different configurations. The basic is the N x N panel of cells, with each cell showing scatter plots plot for a pair of variables at a time. Here is an example of a 3 x 3 scatter plot matrix for the


A year ago I set out to periodically blog from my perspective of leading R&D for our advanced analytics software. I invited SAS colleagues who also work in various areas of advanced analytics to blog on their own interesting conversations with each other and with customers about the intersection of

SAS/GRAPH gives you the ability to customize your graphs (or even create totally new types of custom graphs) ... and it is my firm belief that it gives you a competitive advantage by allowing you to "make sense" of your data in ways your competitors can't. Most of the examples in
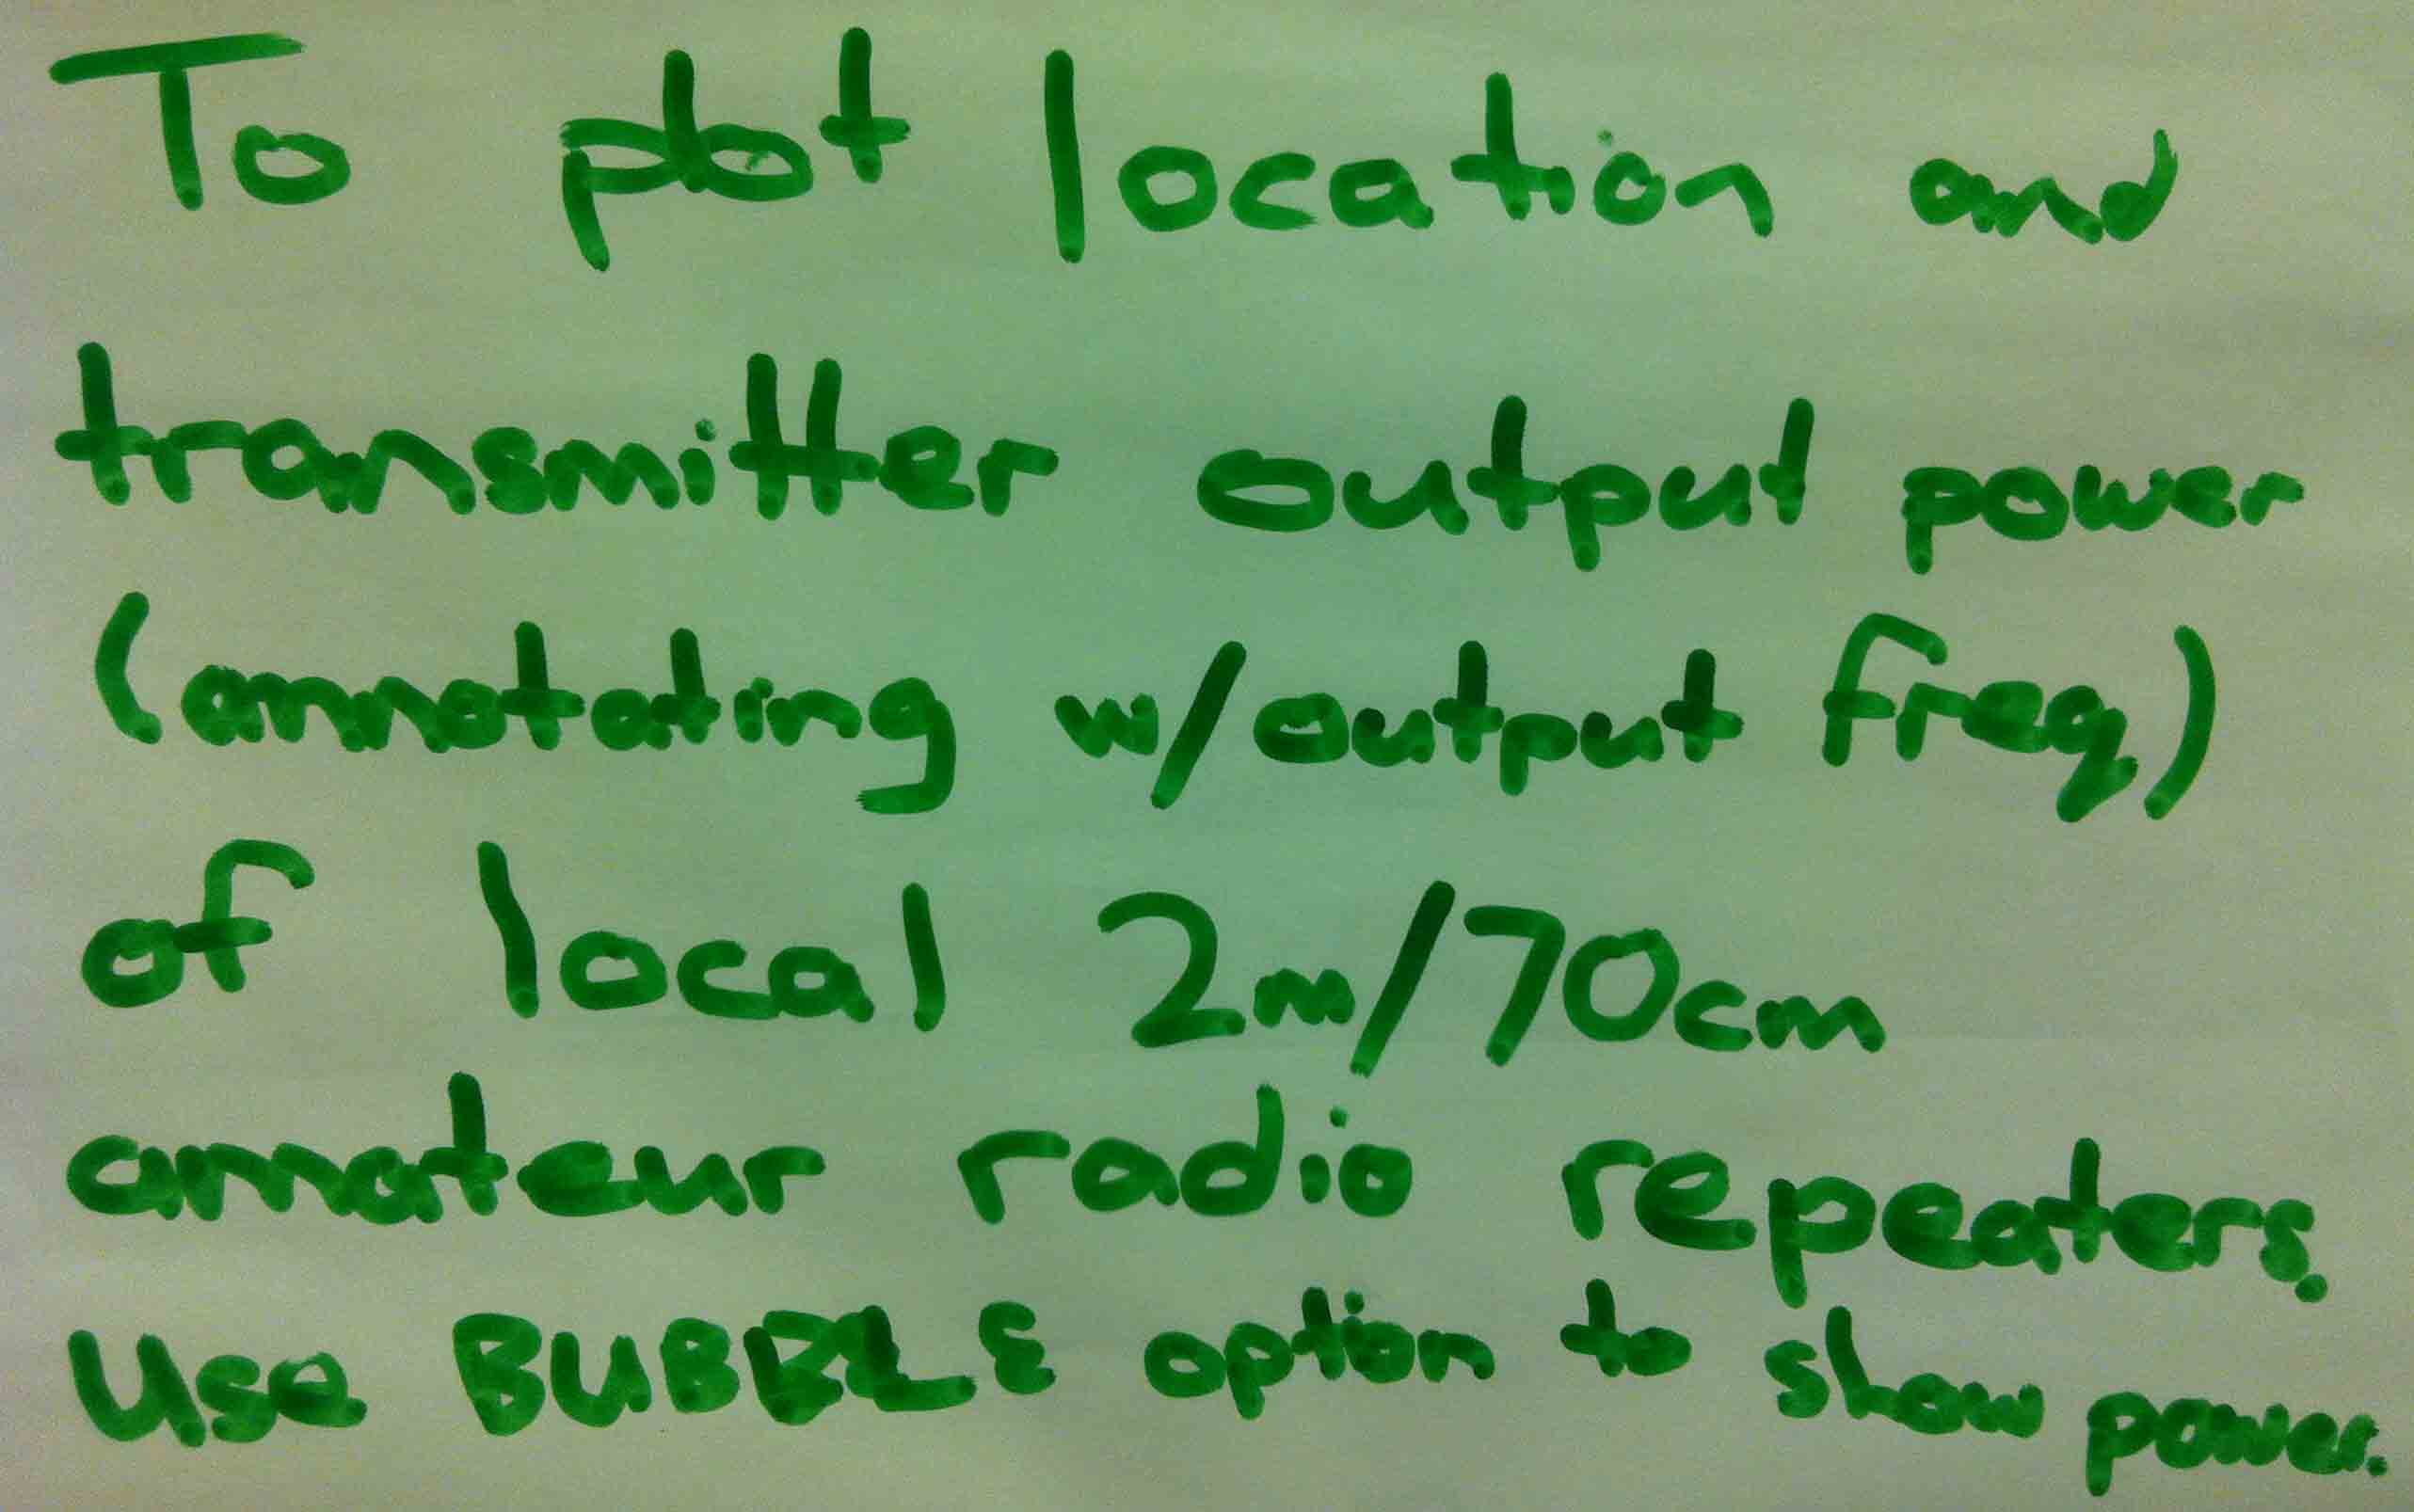
I have to say that I've never heard of the Bubble option, so I looked it up on support.sas.com (my go-to place for searches on customer problems or to simply to learn something about SAS). The search led me to documentation for the statement options in SAS ODS Graphics. So, I assume the


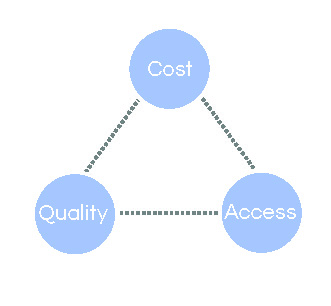
As much as I enjoy dramatic reinterpretations, for this blog post I’m just going to talk to you about the complex challenges municipal organizations face in setting spending priorities. The complexity stems from competing aspects of the various projects vying for funding. Some of these factors are related to the
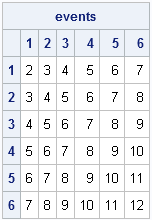
Gambling games that use dice, such as the game of "craps," are often used to demonstrate the laws of probability. For two dice, the possible rolls and probability of each roll are usually represented by a matrix. Consequently, the SAS/IML language makes it easy to compute the probabilities of various

It may only be early October, but now is the ideal time to plan, save and prepare for SAS Global Forum 2013, scheduled for April 28 – May 1 in San Francisco. Three Quick Recommendations 1. Check out the pre- and post-conference classes – The topics are great and the
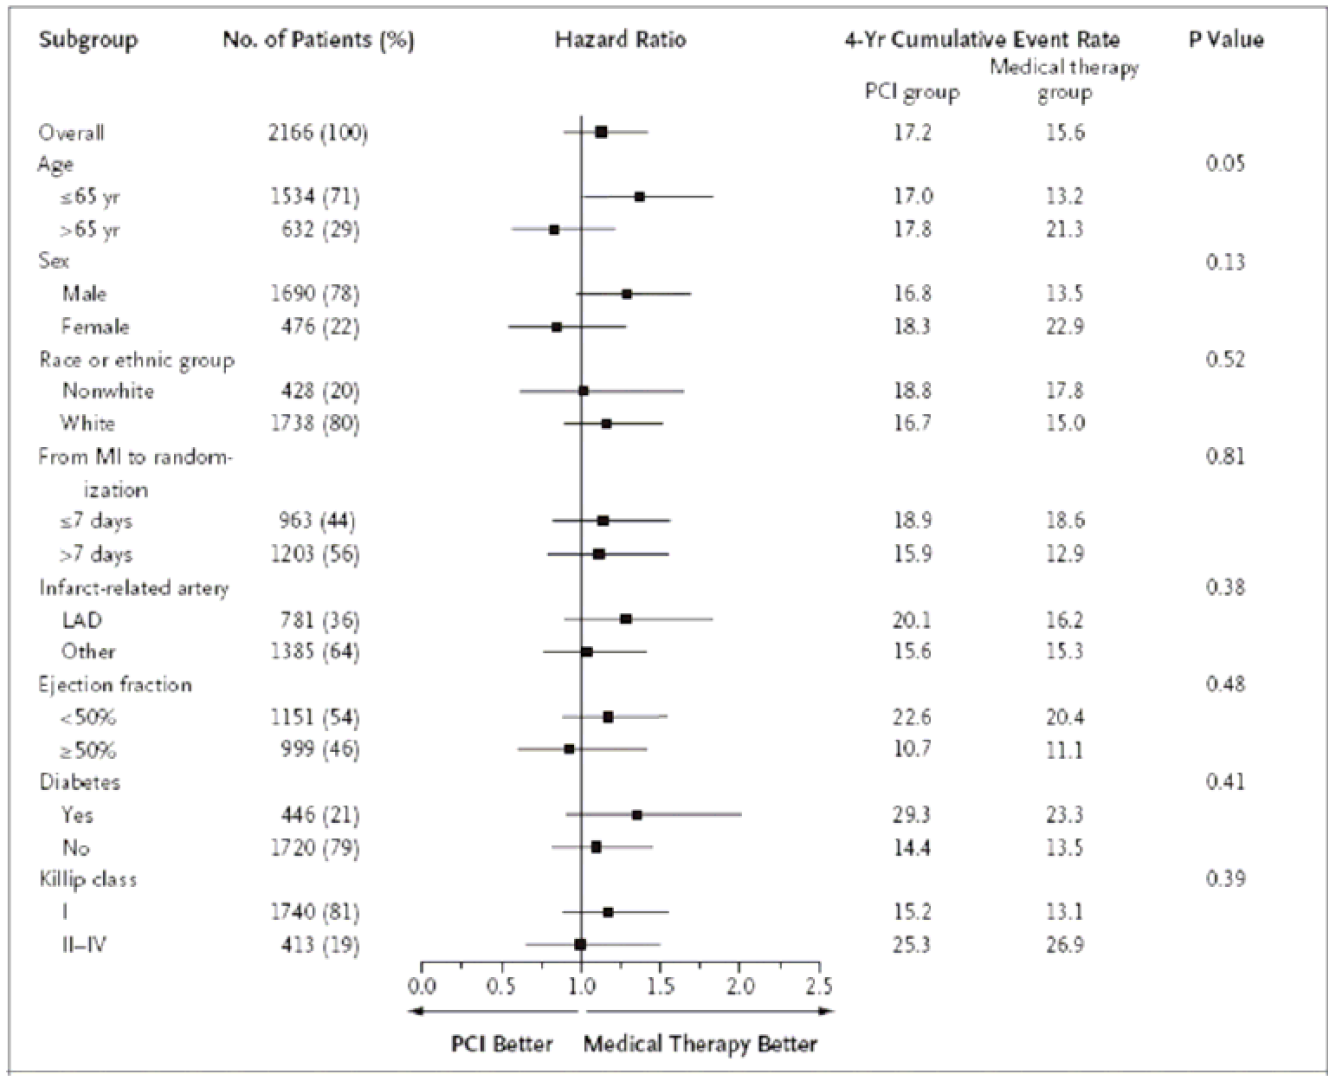
During SAS Global Forum 2012, I had conversations with many SAS users who wanted to create Forest Plots. However, there was one new twist. The study names were subgrouped by categories like 'Age', 'Sex', etc., with multiple entries under each subgroup. The name of each study within the subgrouped was indented