All Posts

The Graph Template Language (GTL) provides you the ability to create complex graphical layouts. We have seen how to create a regular grid of cells based on one or more classification variables using the SGPANEL procedure. Each cell contains the same type of plot. This topic was covered in Dan's article on


Suppose you have an old jalopy that's perfectly reliable. Your jalopy gets you where you wanna go: no frills; no drama. Do you trade your old wheels in for a racecar that accelerates like crazy and corners like it's on rails? Or stick with what's old and comfortable? Your choice


There are many different ways to do something; my approach is all about breaking a problem into smaller problems. I try as much as possible to stay away from developing something that can only serve a purpose in one problem. I achieve this by keeping things modular. Each tool should
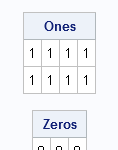

In linear algebra, the I symbol is used to denote an n x n identity matrix. The symbol J (or sometimes 1) is used to denote an n x p matrix of ones. When the SAS/IML language was implemented, the I function was defined to generate the identity matrix. The J function was defined
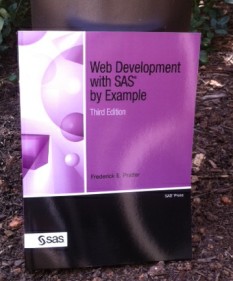

This week's SAS tip is from Frederick Pratter and his book Web Development with SAS by Example, Third Edition. The many real-world examples in the book guide lend it to being frequently excerpted on this blog! Previously featured tips include: Formatting XML documents, Configuring TCP security, and SQL pass-through. The following excerpt is from SAS


Were you at SAS Global Forum last spring? Dr. Goodnight sat down at a computer console and personally demonstrated the cool things that SAS® Visual Analytics Explorer can do? Take a look at his demo, and then imagine working in a drag-and-drop, point and click environment with billions of rows
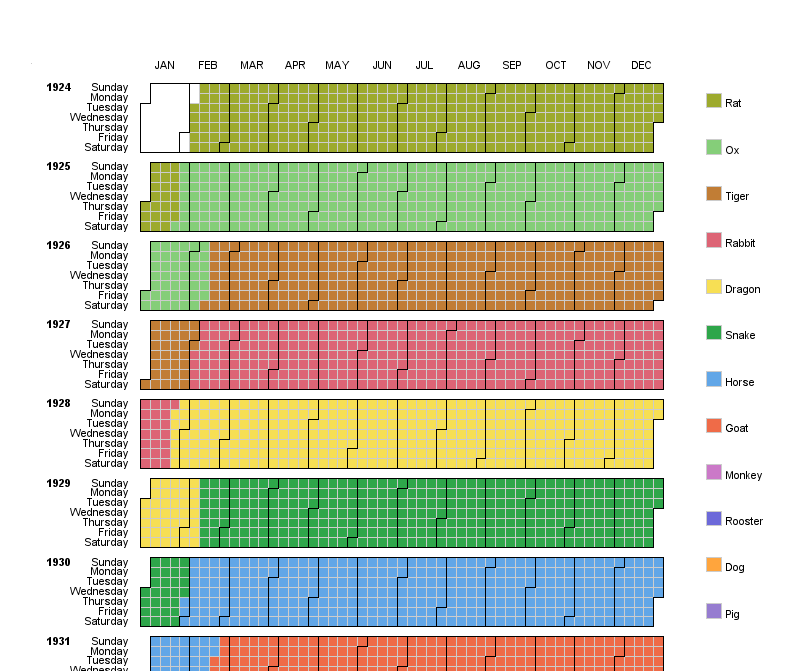

I like to think that I have a graph for all occasions - Chinese New Year is no exception! ... The exact date of the Chinese New Year varies from year to year, because it's based on the lunar (moon) cycles. I thought it would be useful to create a
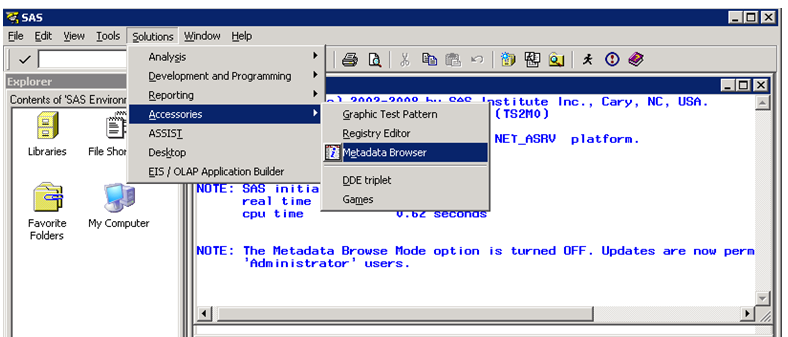

The SAS Metadata Server holds all of the metadata for a given SAS EBI installation. For most SAS administrators, the sole view into the Metadata Server is through SAS Management Console. This is a very limited perspective out of the box, as much of the metadata is not surfaced by

Last week the SAS Training Post blog posted a short article on an easy way to find variables in common to two data sets. The article used PROC CONTENTS (with the SHORT option) to print out the names of variables in SAS data sets so that you can visually determine
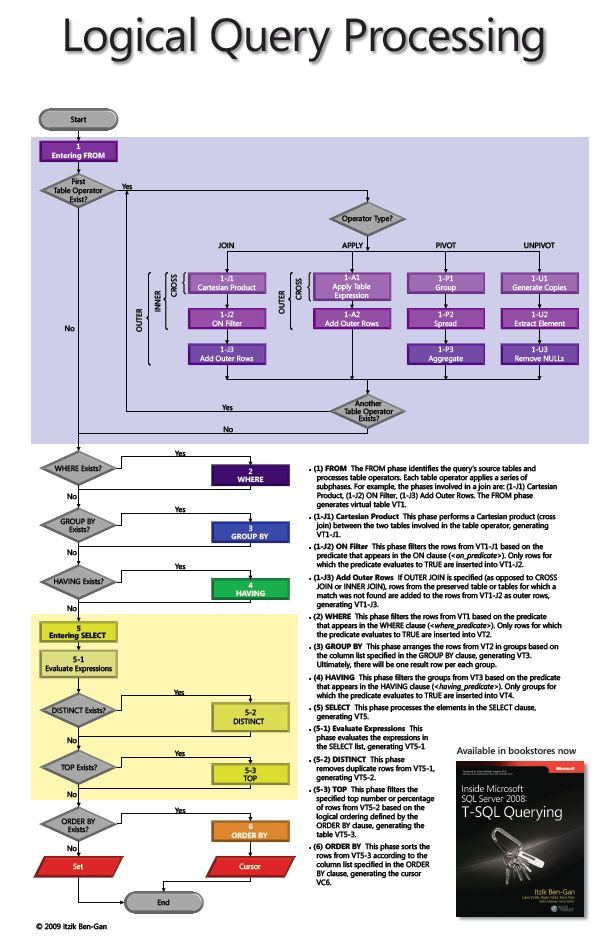

To optimize a Structured Query Language (SQL), the database professional must befriend this order and perhaps even embrace it. Who is your best friend? I’m talking about the order in which SQL processes your statements. Simply put, in what order does SQL do your work? (From my previous post you
Recently a reader chimed in with a question on the Do Loop article by Rick Wicklin on how to create a bar chart with percent statistics. Rick used SAS 9.3 and the reader wanted to do the same with SAS 9.2. For the basic (non-grouped) bar chart, the process is the


When I travel to San Francisco in April for SAS Global Forum 2013, it will make my 12th time to attend the international SAS users group conference, and my 7th consecutive year. A lot of people assume that I automatically go every year, but the truth is that SAS employees

I wanted to write a blog post about the "Table distribution" in SAS. The Table distribution, which is supported by the RAND and the RANDGEN function, enables you to specify the probability of selecting each of k items. Therefore you can use the Table distribution to sample, with replacement, from


How many analytical projects have foundered due to lack of problem definition and other soft skills? As my SAS colleague Sascha Schubert writes, people and process matter, in addition to great technology. Great technology is a great first step, but having the right people following the right process is critically important.

This week's tip is from Gerhard Svolba and his book Data Quality for Analytics Using SAS. Gerhard is a product manager and pre-sales consultant at SAS in Austria, where he specializes in analytics and customer intelligence. Visit his author page to learn more about him and his work. The following excerpt is