Last week there was an interesting question posted to the "Stat-Math Statistics" group on LinkedIn. The original question was a little confusing, so I'll state it in a more general form:
A population is normally distributed with a known mean and standard deviation. A sample of size N is drawn from the population. Each element of the sample is rounded to the nearest integer. The challenge: Construct a sample whose sample mean and sample standard deviation are as close as possible to the population values.
And here is my paraphrase of the actual problem that was posed:
The time required for Sally to walk home is normally distributed with mean 18 minutes and standard deviation 2 minutes. She walks home on 70 days and records her time to the nearest minute. What set of 70 values result in sample statistics that are as close as possible to the population parameters?
If you would like to try to solve the problem on your own, stop reading here. Spoilers ahead!
My approach to this problem is to use the normal density to estimate the number of observations for each value of the integer times 12, 13, ..., 24. Why those values? Because we are told that the mean is 18, and I assume that all the data will be within three standard deviations of the mean: [12, 24] = [18 - 3*2, 18 + 3*2].
In SAS, the PDF function computes the normal density. If you multiply the normal density by the number of observations, you obtain an estimate for the expected number of observation in each unit interval. Of course, this estimate will not be an integer, so use the ROUND function to obtain integers, as follows:
data WalkTimes; N = 70; Mean = 18; StdDev = 2; keep t freq; do t = 12 to 24; pdf = N*pdf( "normal", t, Mean, StdDev); /* approximate expected number */ freq = round(pdf); /* round to integer */ output; end; run; |
It is not clear that this approach will always produce N observations, but it does for this symmetric distribution. What does the distribution look like and what are the sample moments? A quick call to PROC UNIVARIATE answers these questions:
proc univariate data=WalkTimes; freq Freq; var t; histogram t / normal midpoints=(12 to 24) vscale=count barlabel=count; ods select Moments Histogram; run; |
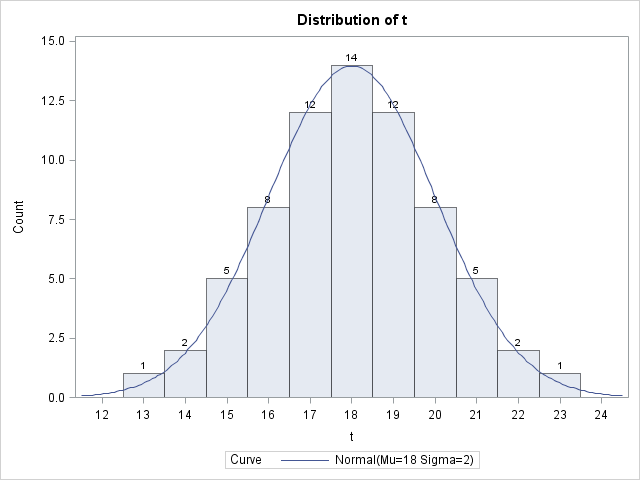
The histogram plots the counts in each interval, displays the empirical frequencies, and overlays the normal curve for the population. There is close agreement between the data and the population. (The procedure also produces goodness-of-fit tests, which I do not show here. None of the tests reject the null hypothesis that the data are from an N(18, 2) population.)
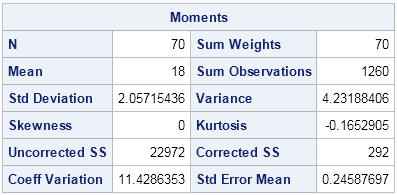
The Moments table shows that there are 70 observations, that the mean is exactly 18, and that the standard deviation is very close to 2. Furthermore, the skewness is exactly zero, which means that the data distribution is symmetric. The small kurtosis value indicates that the tails of the distribution are close zero, which is what you would expect for a normal sample.
I obtained the same data distribution as the person who posed the problem, so presumably he used a similar approach. Other people tried to simulate the problem by generating random numbers from N(18,2) and rounding them to integers.
What approach would you use? Can you come up with a set of 70 integers that do a better job of approximating the N(18, 2) distribution?

10 Comments
Very nice Rick! I think you are right that this may be as close as you could get. You mentioned that the output does show some goodness of fit tests, you could use those to aid in your quest. Instead of focusing on the tests themselves one could ask whether THIS particular solution minimizes any of the goodness of fit statistics within the whole number bounds of the problem. That is to say that solution that would be better than the one you have presented would have a normal fit AND a smaller goodness of fit statistic.
Not exactly related question (but sort of). The Var t sent to PROC UNIVARIATE must be a numeric data type, but if it were a TIME type PROC UNIVARIATE would still treat it as a number. Is the practice to a always deal with TIME units as 1.5 minutes rather than 1 min 30 seconds? Hope I made sense here. I work with a lot of time intervals and that seems to be the only way to work with them in SAS. I'm sure I'm wrong though as SAS always seems to have a solution.
I'm not sure that I understand your question, but I'll try to answer your question anyway. If you have a variable with a TIME format, it is still a numerical variable, it just displays as a string (for example, 12:34:56) when you print it out. SAS time variables are represented as seconds since midnight. Let's say you record the time at which you eat lunch for four days: 11:45:00, 12:00:00, 11:55:00, and 12:05:00. SAS stores these times as the values 42300, 43200, 42900, and 43500. If you want to know the average of these times, you can call PROC UNIVARIATE, but it tells you that the average is 42975. You have to apply a TIME8. format to that value if you want to see the corresponding time-of-day (11:56:15).
When I compute with elapsed times, such as the time it takes to walk home, I won't use a TIME. format. I'll just choose a convenient unit (seconds, minutes, hours,...) and express all times in terms of that unit. In this blog post, I am not concerned with the "time of day," only with elapsed times.
Thanks a lot, Rick! Following your solution above, what're your suggestions to generate random numbers from a predefined distribution rather than "Normal"? For example, what about if we want to have numbers from a Binomial? Can we still write "N*pdf( "binomial", t, Mean, StdDev);", or there're other alternative functions available in SAS? Appreciate your comments.
Just to be clear, this article is not about generating random numbers. The PDF function is used to generate expected values, which are not random. If you want random numbers, use the RAND function.
To answer your question: yes, the PDF distribution supports about 20 or so other distributions, and you can use the same idea to produce expected values from other distributions.
It's clear now. Your comments indeed help a lot to us. Thanks again!
Hey Rick, when using codes in your example to generate numbers from a Normal(or any other distributions) with predefined mean, std, maximum and minimum, I failed to get the "T" with specified moments. My mean=599, std=640 max=7320 min=39. Is there any other options available to handle this? Find a discussion here:http://confounding.net/2010/12/01/randomly-generating-a-truncated-normal-distribution/; As trying it with the parameters above, still suffer big variations in the moments.Thanks in advance for your comments.
The article you linked to is about sampling random values from a truncated normal distribution. My article has nothing to do with random values. If you want random values, use his method. If your problem is that the normal density for your situation does not align with the histogram of expected values, then it is because you aren't plotting the whole data range. Try DO t= -1320 to 2520;
If you still have problems, post your code to the SAS Support Community.
Thank you very much, Rick! I'll recode to see if there are still problems.
Hi Rick, follow up my quetions yesterday, I read through your comments in SAS COMMUNITY:https://communities.sas.com/message/131099#131099, then change to take Gamma distribution(after fitting two parameters with Proc Capability). It finally turns out a simulated distribution that matches the sample data very well.Really thanks for your suggetions here and COMMUNITY.Best regards.