All Posts


I am pleased to announce that this year at SAS Global Forum 2013 (San Francisco, April 27 to May 1, 2013) I am giving a free hands-on workshop (HOW) entitled "Getting Started with the SAS/IML Language." If you are not familiar with the very popular Hands-On Workshop series at SAS
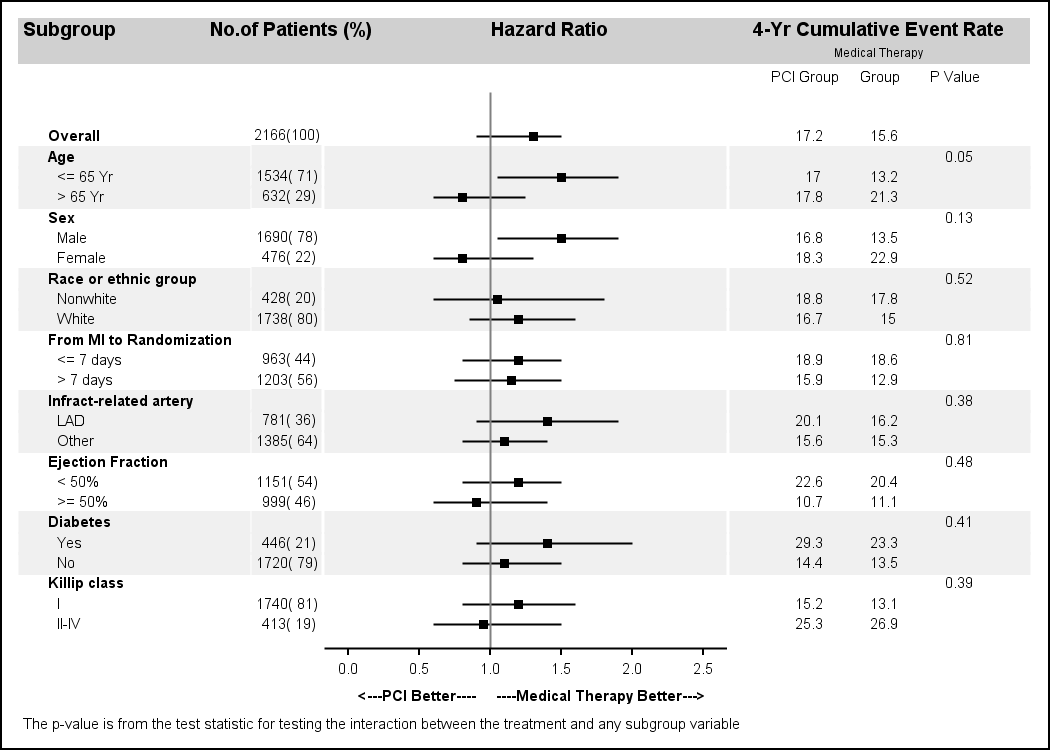

OK, I promise this is the last article on Forest Plots (at least for a while). In the previous article on Subgrouped Forest Plot with Font Attributes, I discussed how to use bold text for subgroup headings. I mentioned that increasing the font size would not work as it would
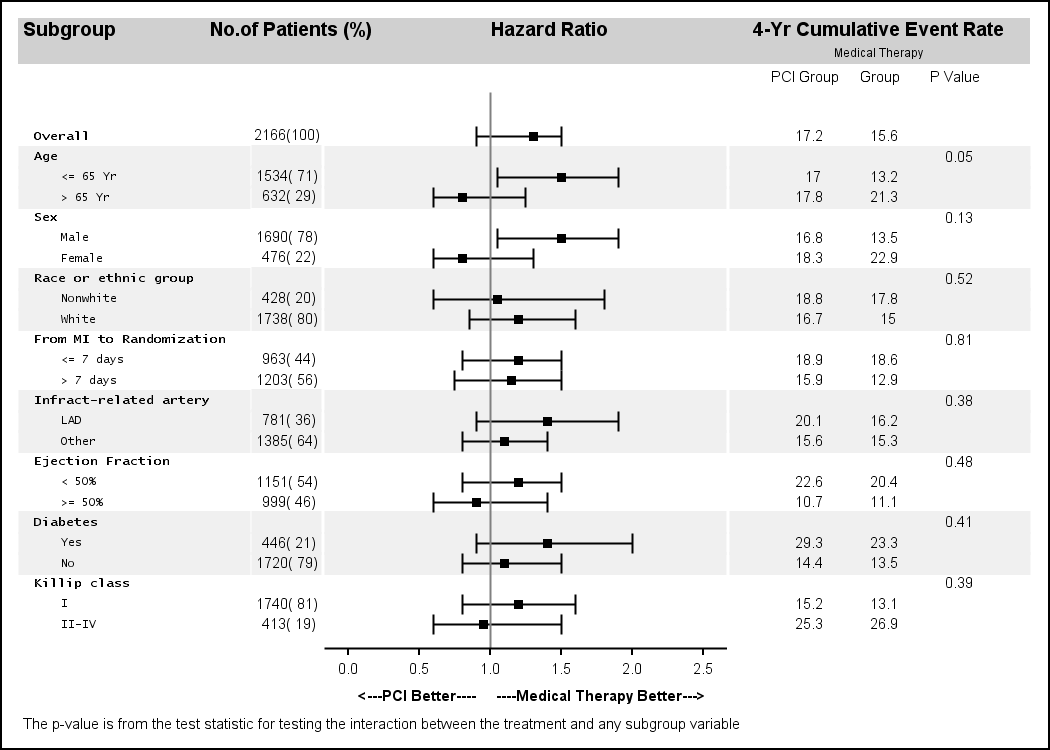
Just a few days ago our "super-duper tech support trooper" called in asking for the link to the subgrouped Forest Plot with bold headings. She was referring to this Forest Plot with Subgroups I had posted earlier. However, as you can see, while the subgroup values are indented from the subgroup headers, the headers


Many of my blogging colleagues are taking this week to reflect on their top posts in 2012. Some are using the visitor statistics to rank the posts, but as Andy Ratcliffe points out, that gives short-shrift to the late-season articles. This year, I'm going to use this space to recap


In the spirit of the new year – the International Year of Statistics – I thought I’d share some different ways to use statistics. Can statistics help you in your everyday life? Certainly! And here's an example to prove it... Let's say you have a dresser drawer full of white socks.

It's the start of a new year. Have you made a resolution to be a better data analyst? A better SAS statistical programmer? To learn more about multivariate statistics? What better way to start the New Year than to read (or re-read!) the top 12 articles for statistical programmers from


In part 1 of my thoughts about analytics maturity, I deferred talking about issues related to the actual assessment of your organization’s level. Today I intend to detail some of the ways my peers and I are thinking about analytical maturity, comment on scales in use today, and address some

Happy New Year! If you have “adopting SAS metadata” as one of your New Year’s resolutions, I’m here to help you! In my last post in the metadata series, I shared with you all of the reasons why I love SAS metadata. I’d like to kick off 2013 with helping

In this final post for 2012, I would like to finish up the panel sorting topic with a discussion on sorting the panel cells by statistic. With this sort, the response or dependent data in each cell is calculated down to a single statistic value (mean or median, for example). These values are
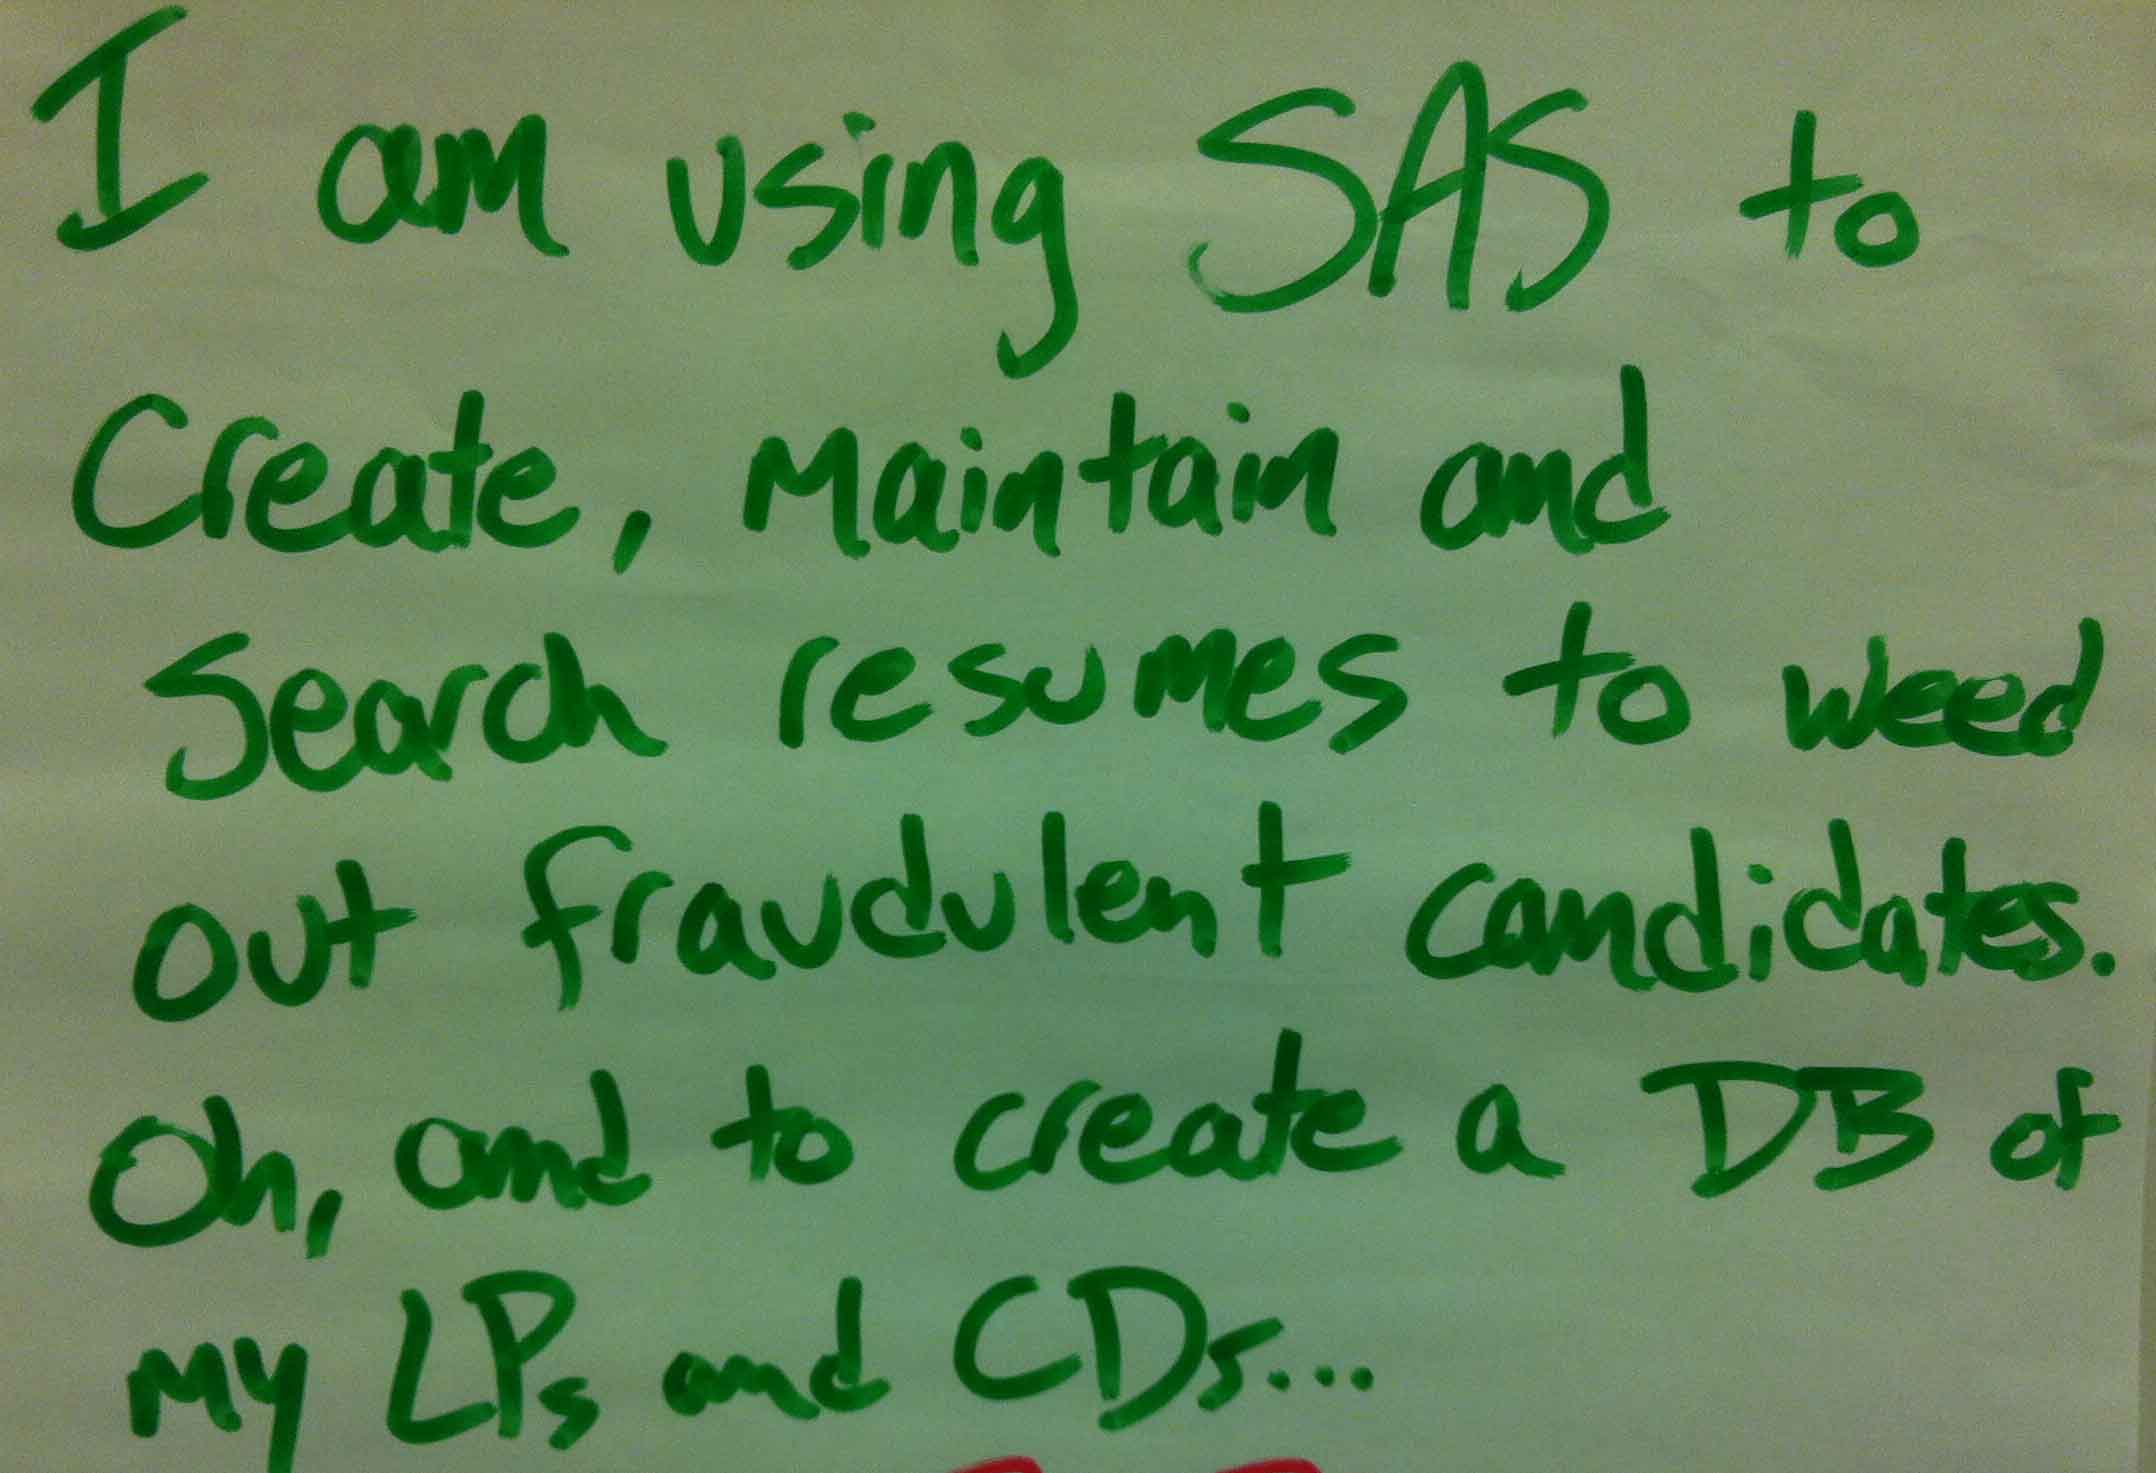

I recently published a post based on an InformationWeek article about the need for more analytic talent and tips for finding the right talent. InformationWeek failed to include information about using SAS to uncover fraudulent responses in applications. This Post-It Note author uses SAS for that and entertainment.
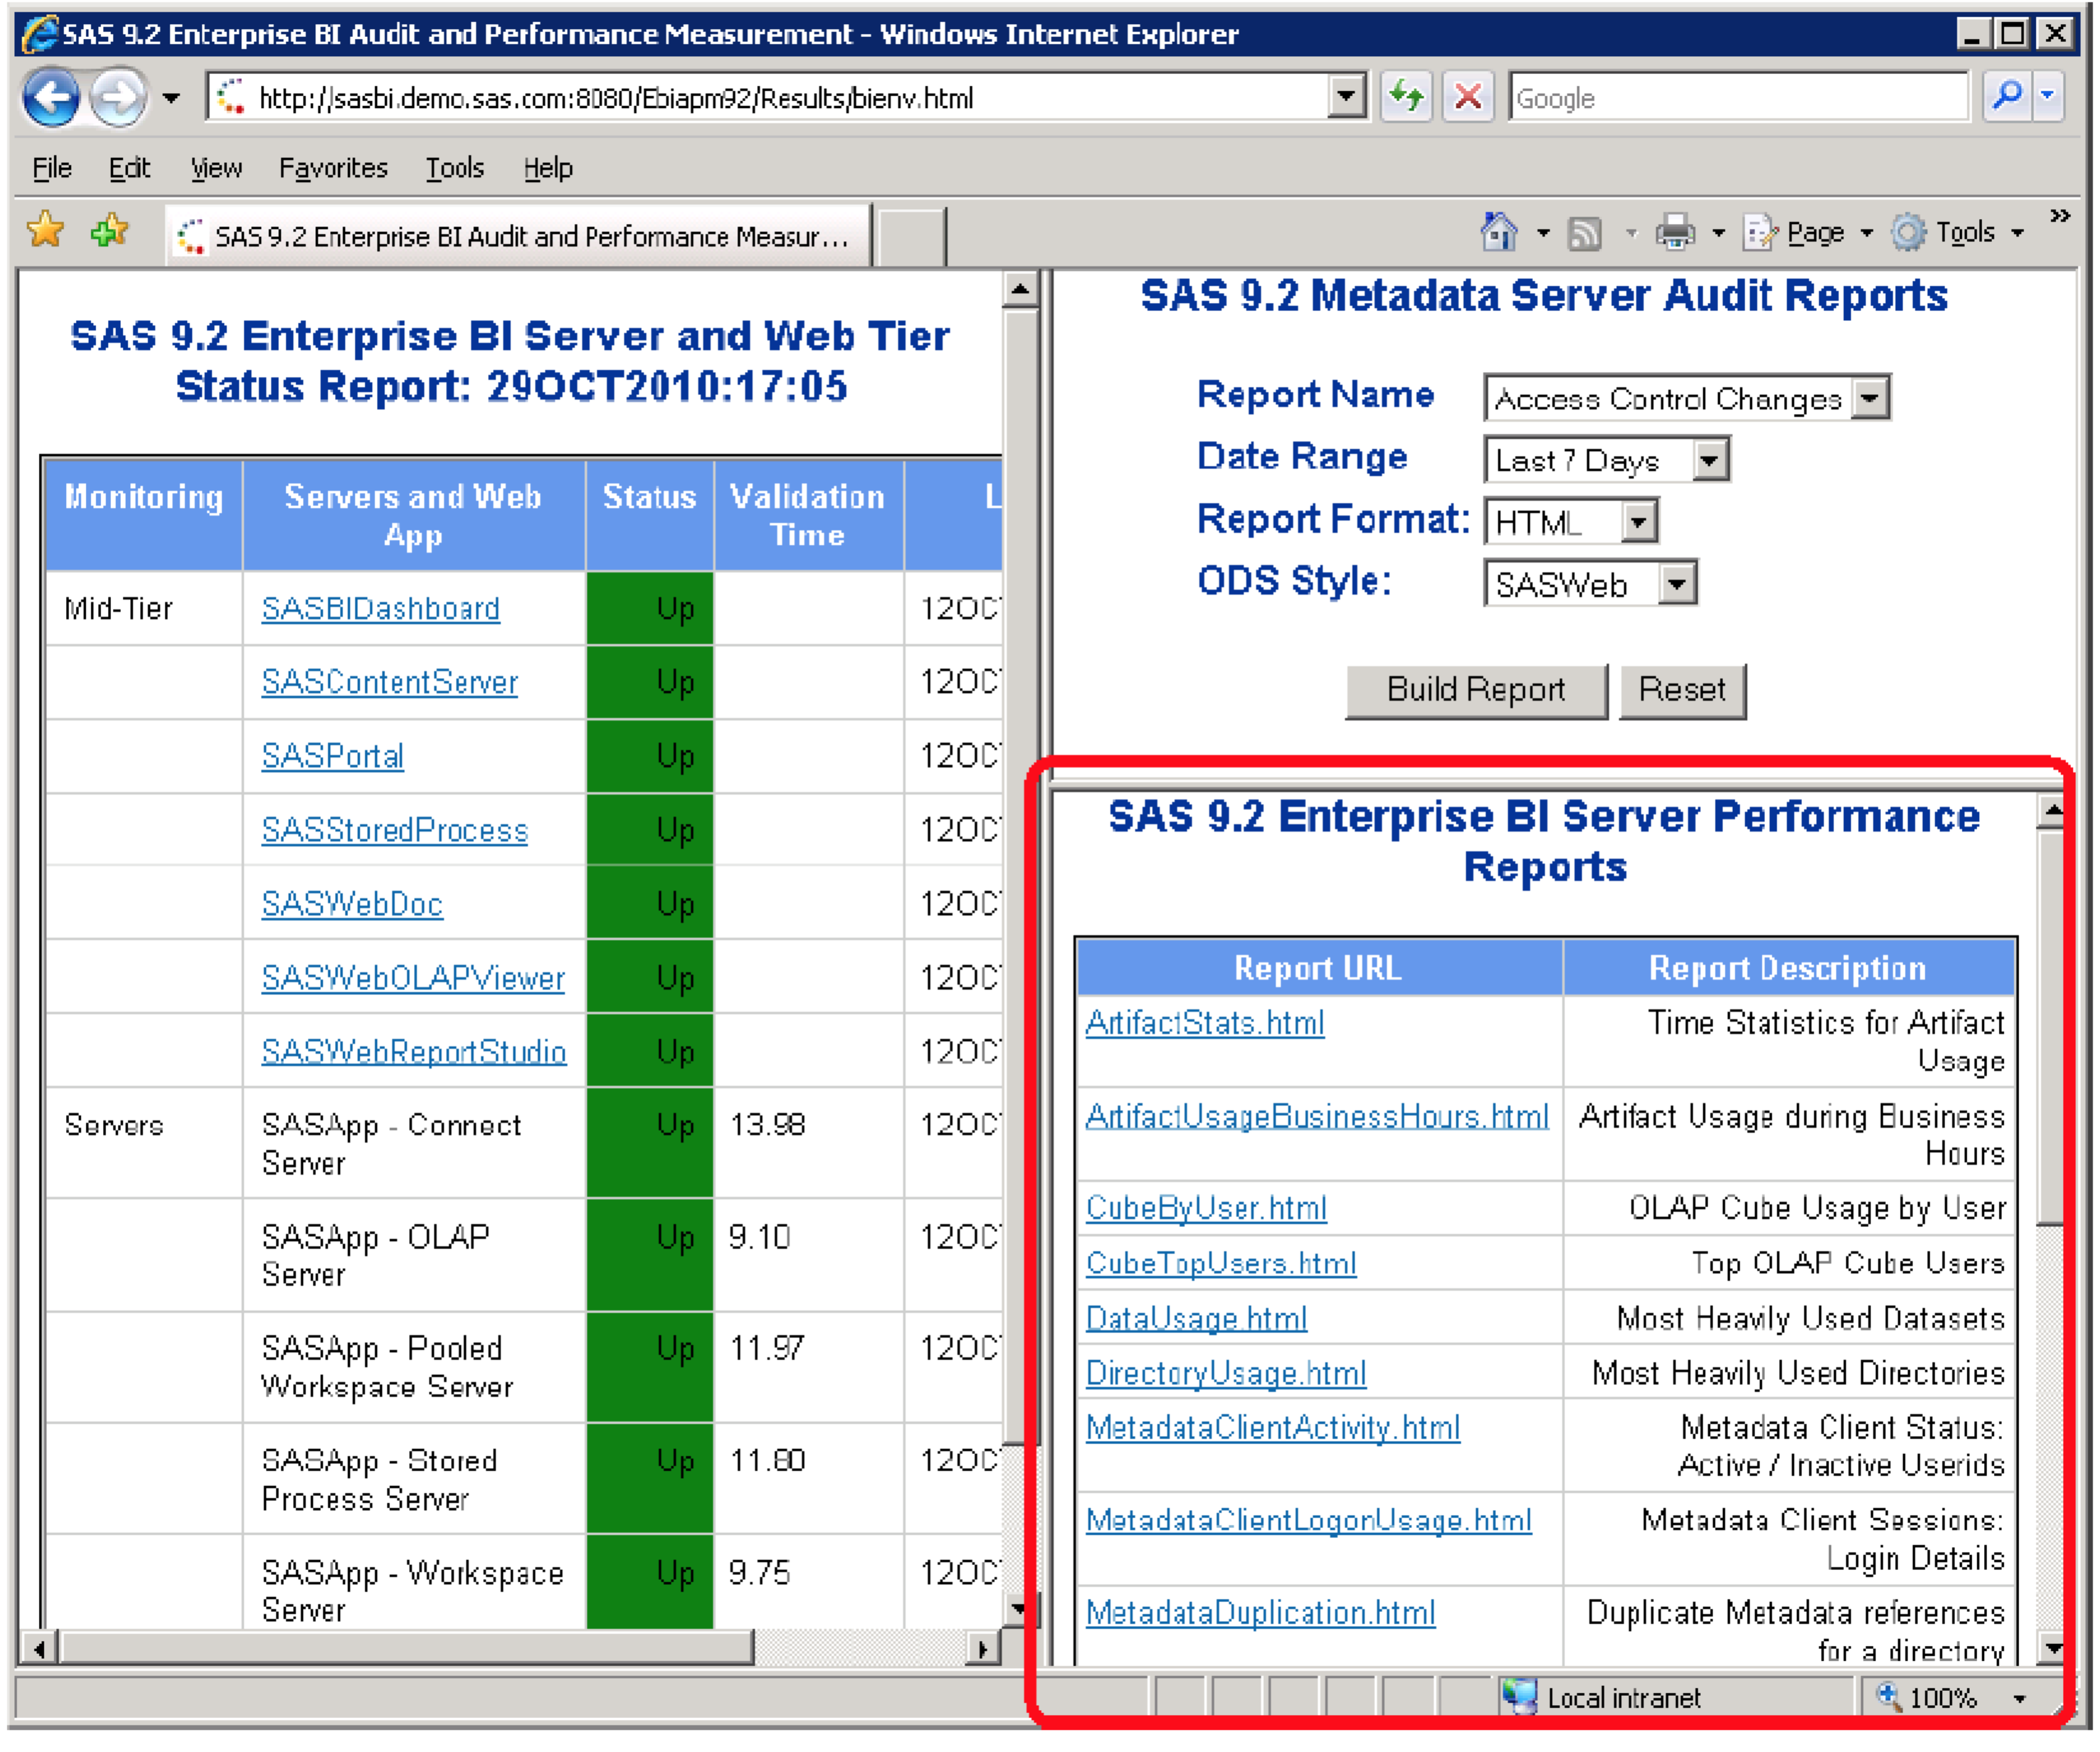

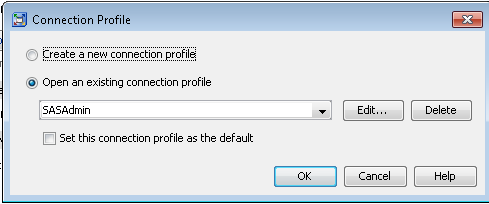
SAS programmers will immediately recognize the importance of reviewing the SAS log to provide insights into what’s going in a SAS program. As a SAS Administrator, however, you rarely have the luxury of being able to sit down with a cup of coffee and read through the server logs to


It's that time of year: too much shopping, endless parties and another round of budget cuts! Whether it's personal or business budgets, December finds many of us looking for ways to be good stewards of whatever resources we have available. One of our teams was recently asked ““If I want
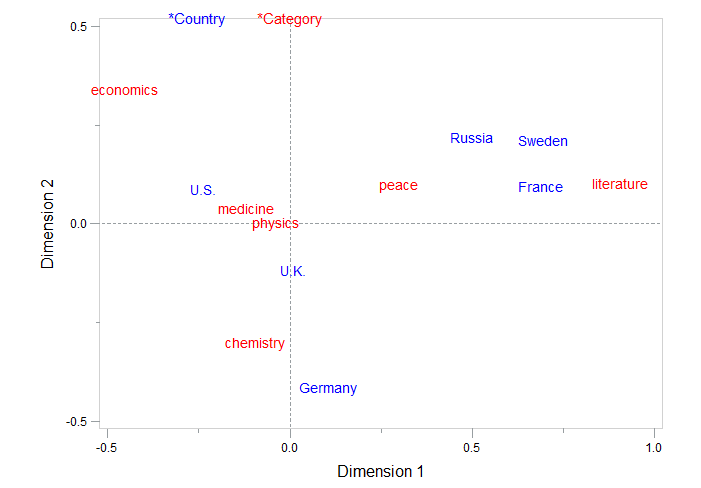

Are you ready for the upcoming International Year of Statistics? I have prepared myself by doing a correspondence analysis. Excusez-moi? Correspondence analysis is a technique that has been very popular in France and is therefore sometimes referred to as French Statistics. Correspondence analysis is a technique for categorical data analysis.


In my first episode of "Adventures in SAS Administration", I want to share how I discovered that "software not licensed for this platform" may actually mean "this software is only licensed to be installed according to a plan".
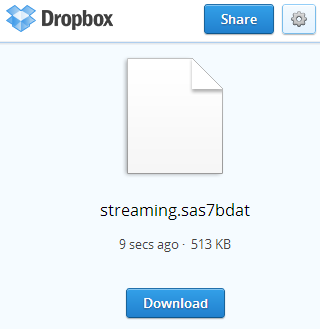
I used "Dropbox" in the title for this post, but these techniques can be used for other cloud-based file sharing services, such as GitHub and Google Drive. Using PROC HTTP (added in SAS 9.2), you can easily access any "cloud-based" file as long as you have a public link to