All Posts


Remember being young and bursting with anticipation of the next show and tell? You knew you had something really amazing to share, and you wanted your classmates to see or hear it. Get ready for that same feeling of excitement and anticipation. Because it’s back. On a much bigger, global


Even the best programmers make mistakes. For most errors, SAS software displays the nature and location of the error, returns control to the programmer, and awaits further instructions. However, there are a handful of insidious errors that cause SAS to think that a statement or program is not finished. For

I'm happy to announce the SAS Data Management support community has a new look and feel! And there’s lots of additional content and resources now too. The SAS Data Management community on support.sas.com is a central hub for anyone interested in SAS data access, integration, quality and governance. Community Manager


In SAS 9.4, the SAS programming language continues add new features by the truckload. I've already discussed PROC DELETE (which is actually an old feature, but like an 80s hit song it's now back with a better version). In this SAS Tech Talk video from SAS Global Forum 2013, I

What do you do all day long? I spend my time speaking with customers about what’s new in SAS 9.4, answering technical questions, and showing new users what they can do in SAS. You might spend your time on SAS data management tasks such as bringing in data and joining


The words "Detox" or "Detoxification" get thrown around a lot these days but few people know what these words really mean. Detoxification in reference to human health refers to your body’s ability to convert, or biotransform, waste products and toxins into non-toxic substances that can be excreted from the body.


As the NorthEast SAS Users Group (NESUG) approaches, I sat down with NESUG volunteer and Executive Committee member Sue Douglass to discuss all the features of this year’s conference and why SAS users can’t wait to register. This year, they’re offering over 125 papers, expanded preconference training sessions and perennial
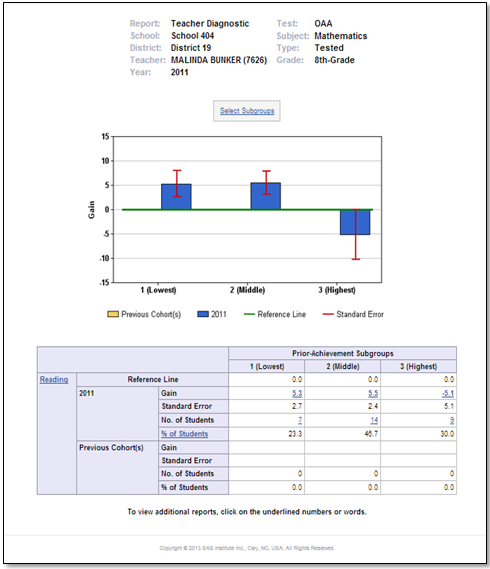

As student growth or value-added measures become more prevalent in educator evaluation systems, many question how those ratings actually help teachers improve their practice. i.e. “How does a level 3 teacher become a level 4 or 5?” Robust and reliable value-added data serve as a great starting point for teachers

The graphs produced by the SG procedures (and GTL) have a default look and feel designed for the common use cases. However, everyone has a preference for some special features that make the graphs unique. Fortunately, extensive customizations can be made to graphs produced by these tools using statement and

John Taylor likes computer data the way he likes big trout: here, there or anywhere. Which is perfectly natural, considering he’s the data analyst in the Inland Fisheries Department at Texas Parks and Wildlife. Taylor describes his unspoiled enthusiasm for big data and big fish in this sendup of Dr. Seuss that
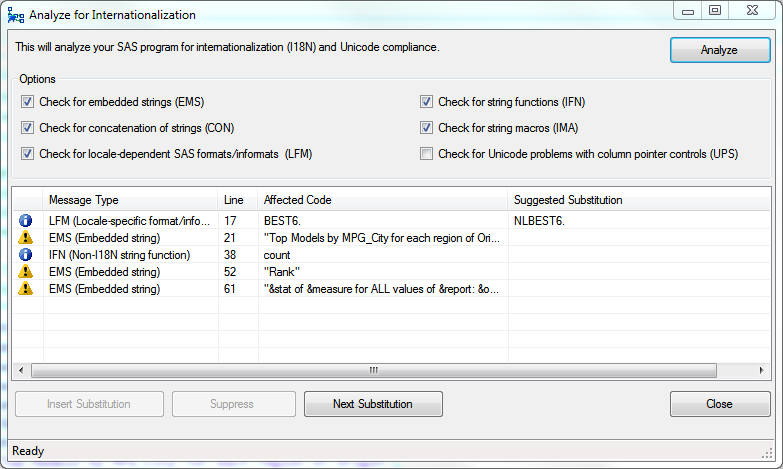
If you're a software developer, you're probably already familiar with these terms: I18N and L10N. Internationalization (I + 18 letters + N = I18N) The discipline of preparing your software to run correctly in different languages with different culture settings. For example, the software must be able to accommodate multibyte


An updated version of the SAS Hot Fix Analysis, Download and Deployment Tool (SASHFADD) has just been released on the SAS Technical Support Hot Fix site. If you are not familiar with SASHFADD (pronounced SAS-H-F-ADD), it’s a tool that will analyze a SAS 9.2, SAS 9.3 or SAS 9.4 deployment

With the pervasiveness of mobile devices, being able to read while “on the go” has been easier than ever. How many times have you found yourself in a situation where you pass the time waiting by reading something on your phone/iPad/tablet etc? With eBooks on my iPad, I find that
As promised, here is a better combined AE-CM graph, using some of the UI improvements suggested by our UI expert, Riley. His suggestions helped to reduce the clutter in the graph, while still keeping all the features preferred by our users. Click on the graphs for a higher resolution image.

With the release of SAS 9.4 (which included SAS/STAT 12.3 and SAS Enterprise Guide 6.1), you might seriously consider hiring a Chief Versions Officer (CVO). Fortunately, most of the recent versions of SAS Enterprise Guide work with the different recent versions of SAS, so you have some flexibility as you