All Posts
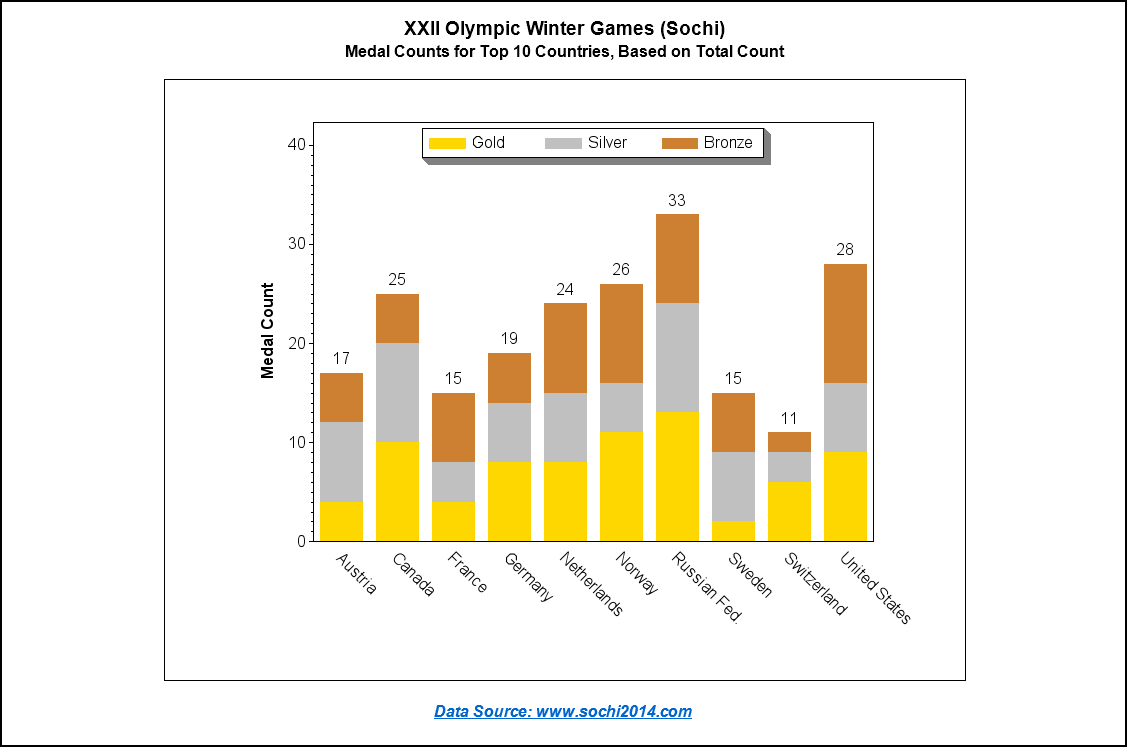

Michele Ensor recently posted a wonderful blog with a graph of the 2014 Winter Olympics medal count. I'm going to further refine that graph, making it an Olympic graph ... on steroids! :) Here is Michele's graph: First, let's give it a few simple cosmetic changes. I always like to have


My journey to SAS Global Forum each year resembles a Gartner “Hype Cycle”. Every year, I leave the conference with a million ideas about how I can take what I’ve learned back into my own practice and think (foolishly) that I should write a paper on this or that. Then there


In Part 1, we reviewed 3 nutrients that help stabilize moods: Folate, Omega 3 Fatty Acids and L-Theanine. Read further to learn 3 additional nutrients that have a positive impact on our moods and energy levels. 4. MAGNESIUM Magnesium is crucial for more than 300 body functions including anti-anxiety benefits.


Having served as conference chair for last year’s SAS Global Forum, I am so looking forward to just being a normal attendee at this year’s conference in Washington, DC. That’s right, I’ll have no speaking commitments, no interviewers, no responsibilities—just the privilege of selecting the content that is right for


Networking with other SAS users is what I love most about SAS Global Forum! At every conference, I look for ways to find those who share my interests or whose experience sheds new light on my use of SAS software. When I come across tips on networking, I always try


Like many SAS programmers, I use the Statistical Graphics (SG) procedures to graph my data in SAS. To me, the SGPLOT and SGRENDER procedures are powerful, easy to use, and produce fabulous ODS graphics. I was therefore surprised when a SAS customer told me that he continues to use the

Classification panels are a very popular visual representation of the data, where the data is gridded by class variables all in one graph. This makes it easy to compare and contrast the data by these class variables. The SGPANEL procedure makes this easy, and most of the time it is
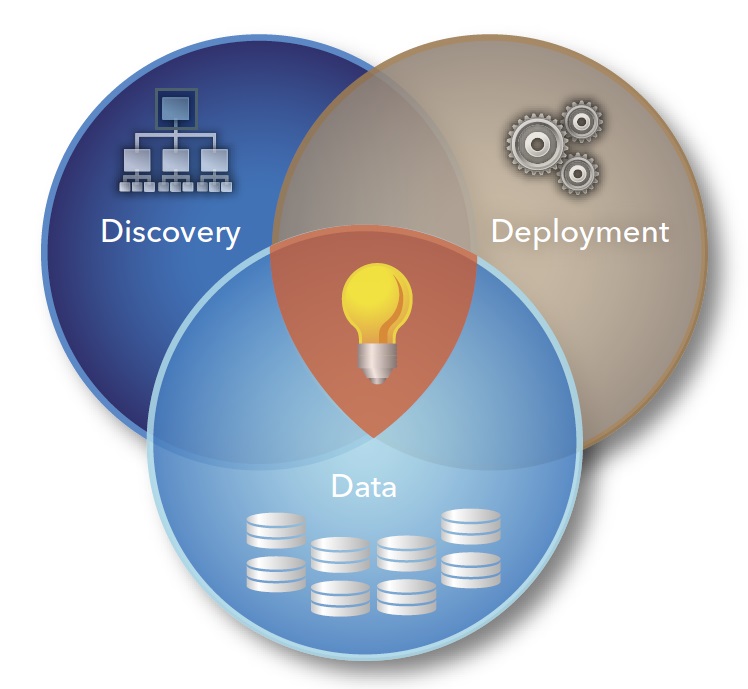

IT support levels for different processes and business applications depend on many factors. So how are analytics projects generally supported? It's common for IT to view the implementation of advanced analytics as part of a production job or process, especially when analytic models are deployed into different operational systems that are

SAS administrators now have another tool to keep SAS users from straying off their permitted path: the LOCKDOWN system option. The option was introduced in "stealth mode" for SAS 9.4. In SAS 9.4M1, it became a true, documented option. For the official guide to creating "locked-down servers", see the SAS


Most SAS programmers would agree that they use the SET statement without giving much thought to the syntax, because it’s such a widely used statement of choice. We routinely name the expected data sets and possibly a few options, and away we go. A visit to the documentation can be


People who know me know that there’s one thing I hate at work – duplication of efforts. I’m not talking about working on a problem in a coordinated fashion. I’m talking about two or more people doing the same work, to answer the same question. Without coordination, there will be


All work and no play makes Ed a very dull boy. So, I took the family skiing last week. It was a blast. They had a good time out there shivering in the snow, doing stuff like: fall down, get up, repeat. Not my idea of fun. I spent my
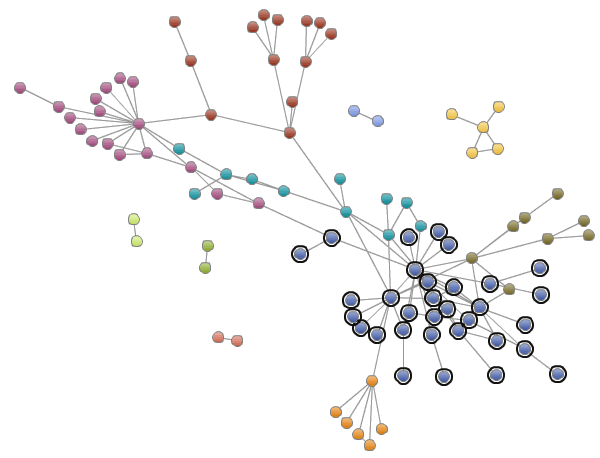

In this interconnected world, it is more important than ever to understand not just details about your data, but also how its different parts are related to each other. Social networks reveal often surprising details about what people think about your product or services, how they are linked to other
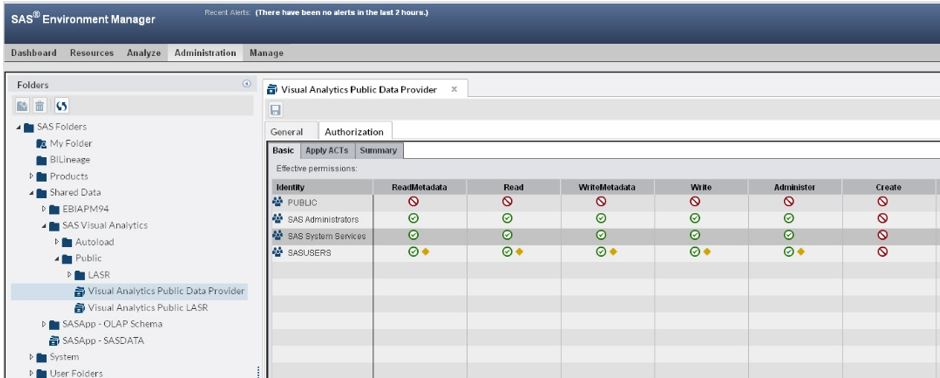

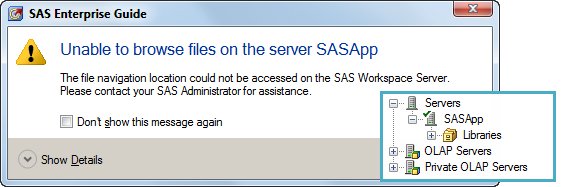
SAS Environment Manager 2.1 (which was released with SAS 9.4 M1), has new features to make it easier to manage your SAS environment. For example, it now supports metadata clusters, and it has an improved method for handling access to the application. But the biggest change is in metadata access.
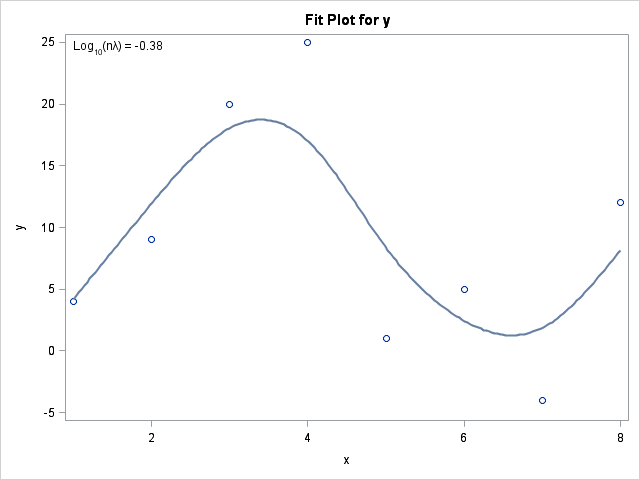
My previous post described how to use the "missing response trick" to score a regression model. As I said in that article, there are other ways to score a regression model. This article describes using the SCORE procedure, a SCORE statement, the relatively new PLM procedure, and the CODE statement.