All Posts


I led an analytical culture track at the SAS Global Forum Executive Conference last month in Washington, DC. I talked with leaders in fields as diverse as healthcare, chemical manufacturing and government. Although these organizations have very different operating models, their challenges, comments and questions were similar. They all recognized

I was asked to speak recently on a topic that includes two hyped terms: Big data and sustainability. At the risk of igniting an anti-buzzword campaign, I added a third over-used term to that list: analytics. Even though individuals and companies use those three words – big data, sustainability, and


With as much as I travel, I have to confess that I’ve become a bit of a food snob. And for good reason, I might add. Two days in a Chilean hospital will make anyone stick with what they know and trust. After that experience, it was just me and
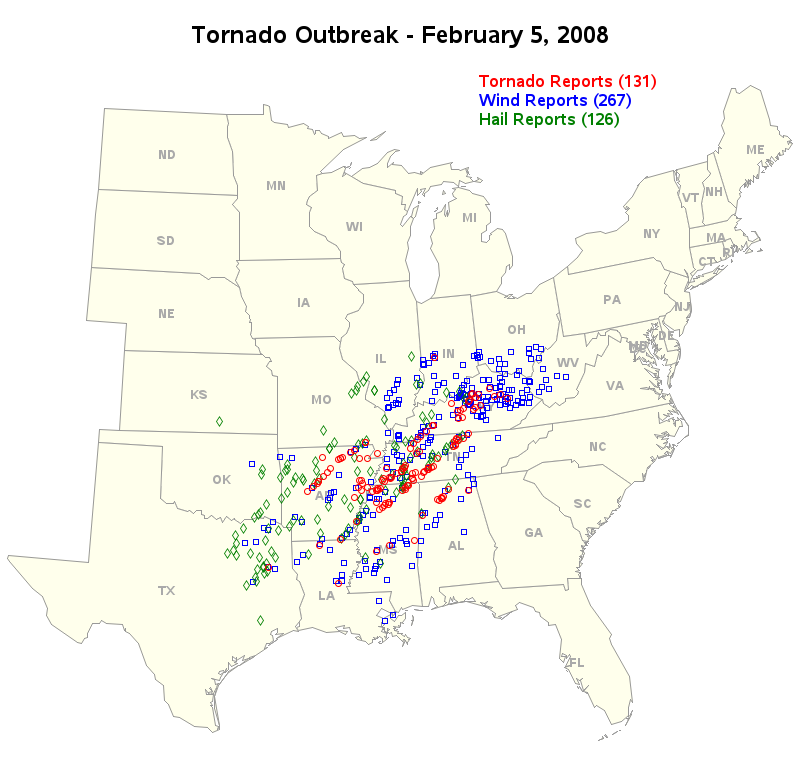

Last night, here in the U.S., an outbreak of deadly tornadoes tore across several states. Unfortunately, nobody knows how to predict a tornado with certainty, but let's brainstorm on how SAS Software can help analyze the data in the aftermath of a natural disaster like this... Being a graph guy, the first
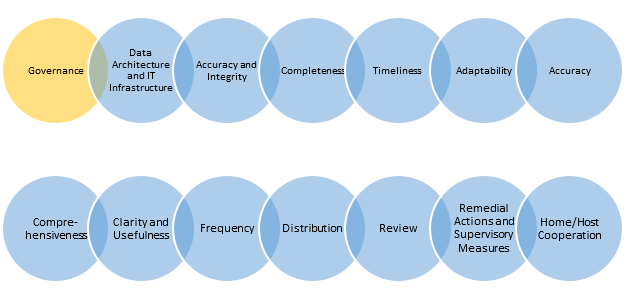

Principle 4: Completeness – A bank should be able to capture and aggregate all material risk data across the banking group. Data should be available by business line, legal entity, asset type, industry, region and other groupings, as relevant for the risk in question, that permit identifying and reporting risk

The series plot is a popular way to visualize response data over a continuous axis like date with a group variable like treatment. Here is some data I made up of a response value by date, treatment, classification and company that makes the drug. The data is simulated as shown in the attached program


What if virtual reality technology allowed you to immerse yourself in big data? That could be your future – and sooner than you think. It happened in August 2013 at the University of Washington: the first direct brain-to-brain communication, with one researcher controlling another researcher’s brain over Skype. Maybe in


Over the past few months, many US states and districts have received data about student growth and teacher effectiveness. Some educators experience the excitement of outstanding scores and, most importantly, the success of their students’ growth. Some quietly plug along, satisfied to be meeting growth targets and deciding if it isn’t broken,

In our hyper-connected world, information technology plays a key role in nearly every field and industry. Higher education is no exception, and that’s where EDUCAUSE comes in. This non-profit association works to advance higher education through the use of information technology. One of the primary ways EDUCAUSE achieves its goal


Super foods have been all the rage for the past few years. We’ve all heard about certain super foods that are darlings in the media like kale, blueberries, acai berries and salmon to name a few. What about other super foods that maybe aren’t so sexy like sardines, organ meats,

Solving the mystery of Malaysia Airlines Flight 370 hinges on the finding the plane's black boxes, or flight data and cockpit voice recorder. An airplane’s black box is something we hope never has to be used, but when there’s a problem, we sure are glad that it’s there. The black
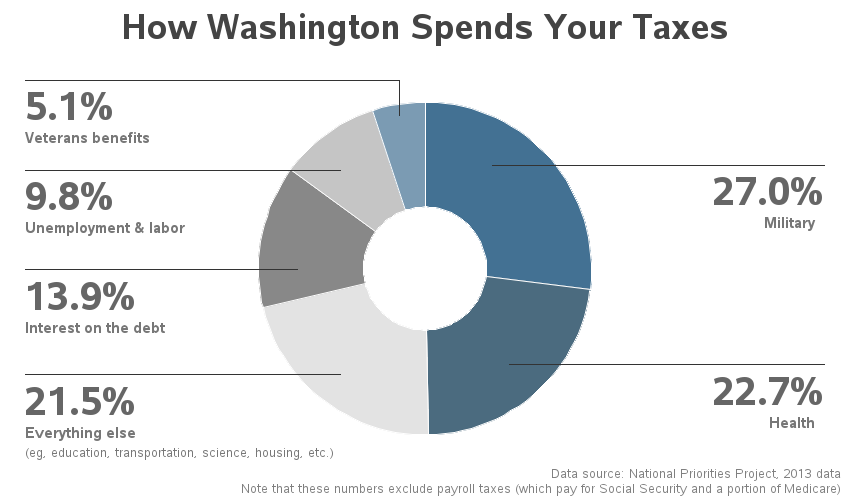
As I was doing my taxes, I wondered where the government is spending my tax dollars. And being a SAS user, I decided to find out using a graph ... I did a few Google searches on "tax graphs" and found one on the CNN web site that I liked - it


The call for papers is open for all 2014 US regional users conferences. A few deadlines are just around the corner, and you won’t want to miss them! WUSS 2014 – May 5 SESUG 2014 — May 19 MWSUG 2014 — June 13 SCSUG 2014 — June 30 Spring is a difficult time


I’ve been to a fair number of SAS User Group International (SUGI) and SAS Global Forum conferences over the years, but I don’t think I’ve been to one as productive, well-organized and fun as this year’s conference in Washington DC. Part of what made the conference very relevant for many
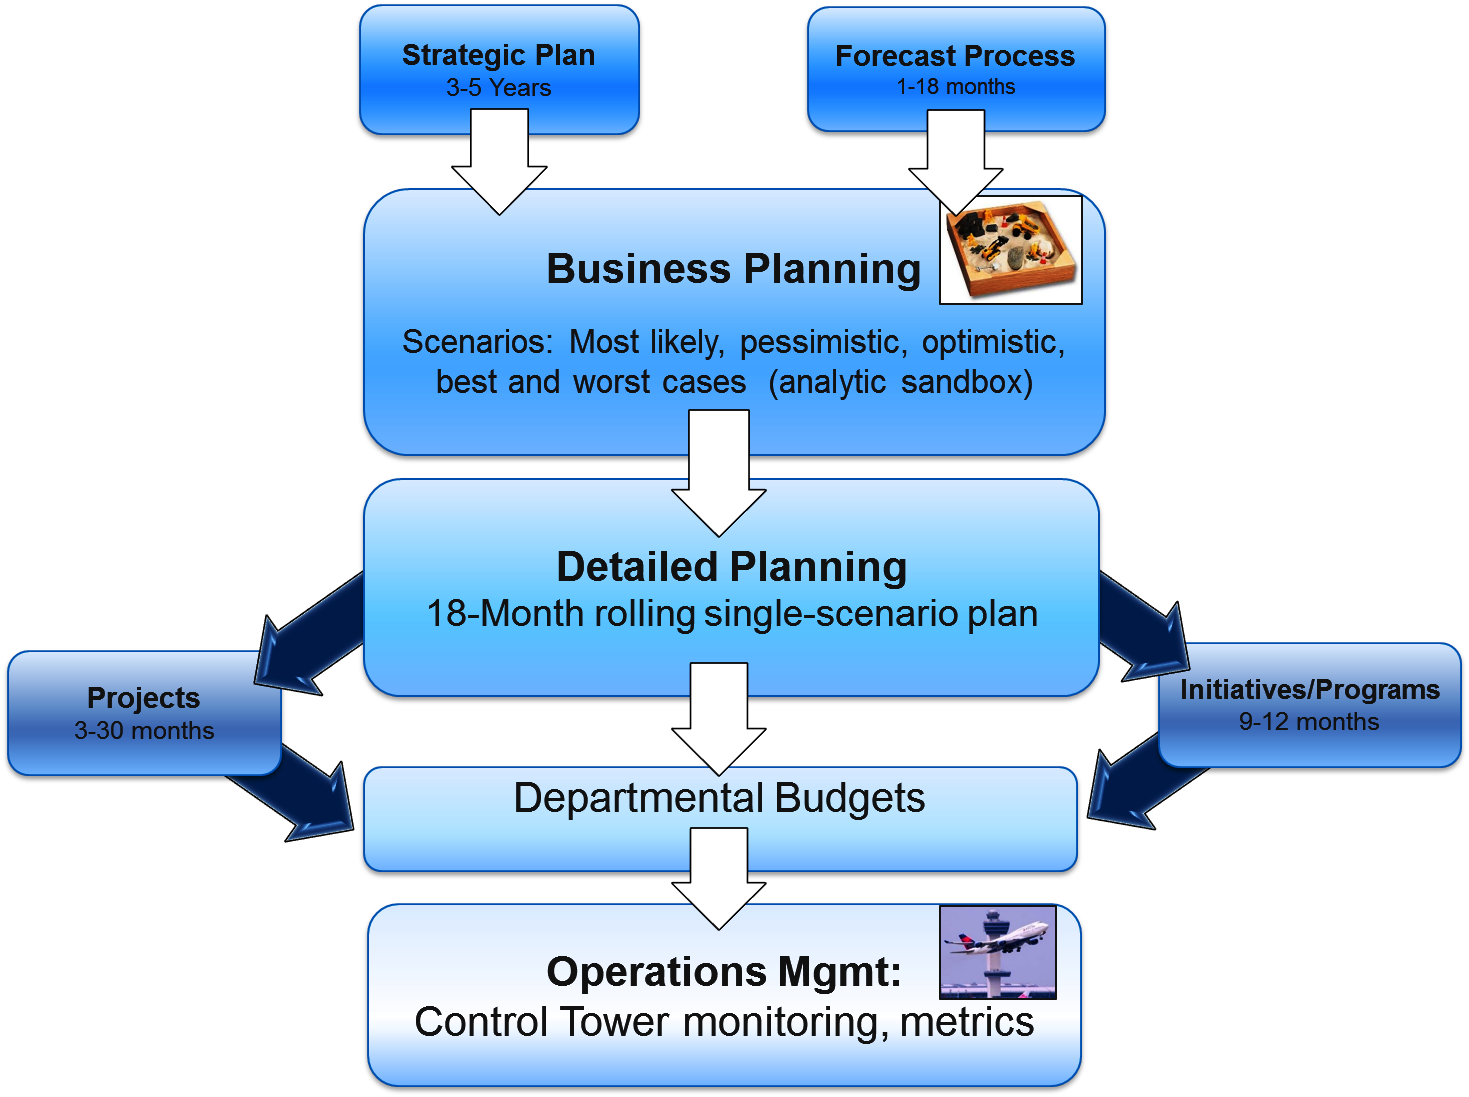

Analytics gives us not just the ability but the imperative to separate our planning activities into two distinct segments – detailed planning that leads to budgets in support of execution, and high-level, analytic-enabled business/scenario planning. My critique of Control Towers in this blog last time led me not only to