All Posts


When someone is sick or in the hospital, it may not be long before the casserole patrol comes a knockin'. "Casserole patrol" is the term a witty colleague of mine used to describe the friends and neighbors who bring food when someone is sick. I've been there before, standing at a doorstep with a pot of chili
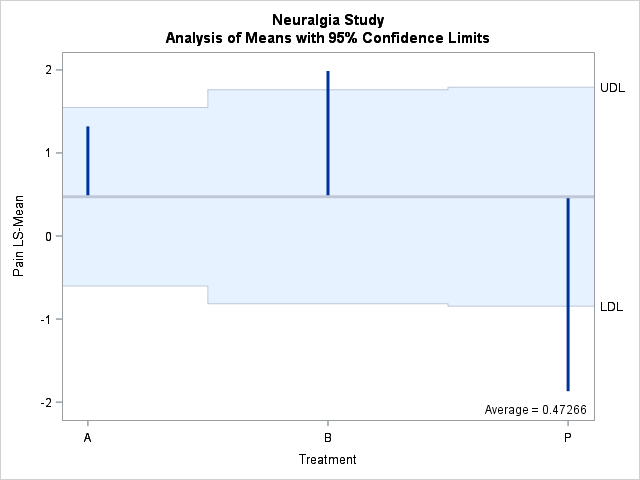

Have you ever wanted to modify a graph title that is produced by an analytical procedure? You can make a wide variety of changes by modifying the graph template. Modifying the graph template is straight forward. You specify ODS TRACE ON, run the procedure, find the template name, display the
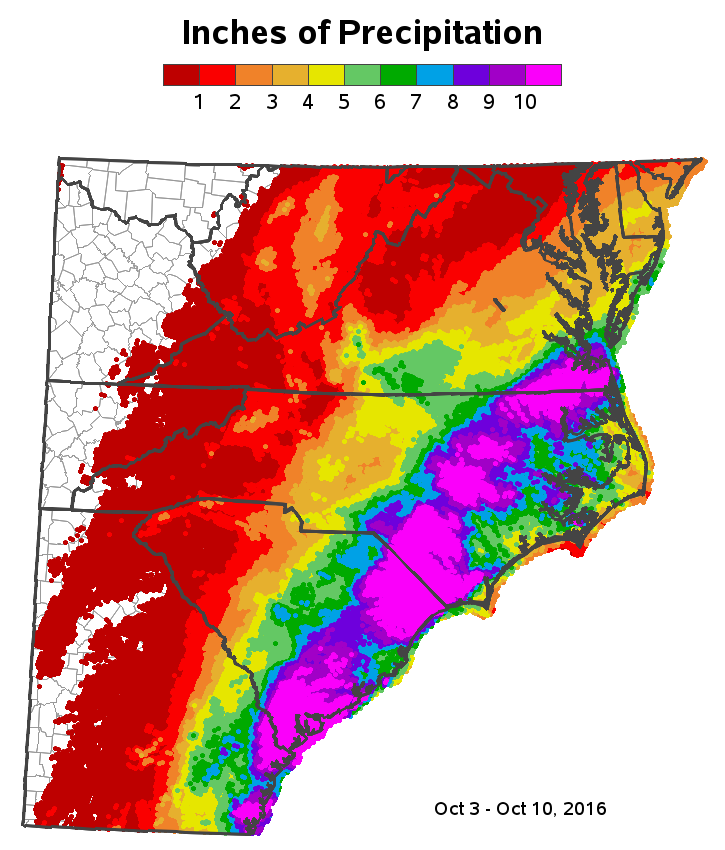

This past weekend, Hurricane Matthew came through the Carolinas. Some areas had record flooding, while other areas didn't. I was anxious to get back to work today, so I could use SAS software and create a custom map showing who got how much rain. But before we get to the official


Data governance must encompass management of the full life cycle of a data policy – its definition, approval, implementation and the means of ensuring its observance - David Loshin, Data Policies and Data Governance I was checking out my Google stats on Data Quality Pro recently and observed that "How


La volatilidad de demanda y expansión de portafolio de productos, así como la persistente presión de alinear los costos de la cadena de suministro con la demanda del mercado, son solo algunos de los retos que enfrentan las organizaciones de industrias como manufactura, alimentos y bebidas, farmacéuticas o automotriz. La


Have you ever been involved in executing an exploratory analysis based on an integrated clinical trial database? If so, you've probably experienced firsthand how elaborate the initial phase of data access and data processing can be. Market analysts estimate the ratio for preparing the data, compared to actually analyzing the information,
When you were growing up, did you ever imagine that the most popular show on TV would be 24-hour coverage of a storm?!? Yes, for better or for worse, the weather has become our new reality TV. And as you watch the weather coverage, you probably see all the weather reporters showing the


Data governance has been the topic of many of the recent posts here on the Data Roundtable. And rightfully so, since data governance plays such an integral role in the success of many enterprise information initiatives – such as data quality, master data management and analytics. These posts can help you prepare for discussing


Machine learning is taking a significant role in many big data initiatives today. Large retailers and consumer packaged goods (CPG) companies are using machine learning combined with predictive analytics to help them enhance consumer engagement and create more accurate demand forecasts as they expand into new sales channels like the


Are you happy with the ROI on your analytics investments? Recently we’ve seen an upswing in organisations investing in analytical platform capabilities. One can assume the goal of these investments is to turn transactional data into a strategic asset. However, analytics alone will not do it. Unless your organisation is

Real world data collected in a functioning health care setting instead of a controlled clinical environment can provide opportunities for new and deeper insights across life science and health care organizations. However, managing, analyzing and extracting actionable information from the varied available sources can present unique challenges. The sheer size of these
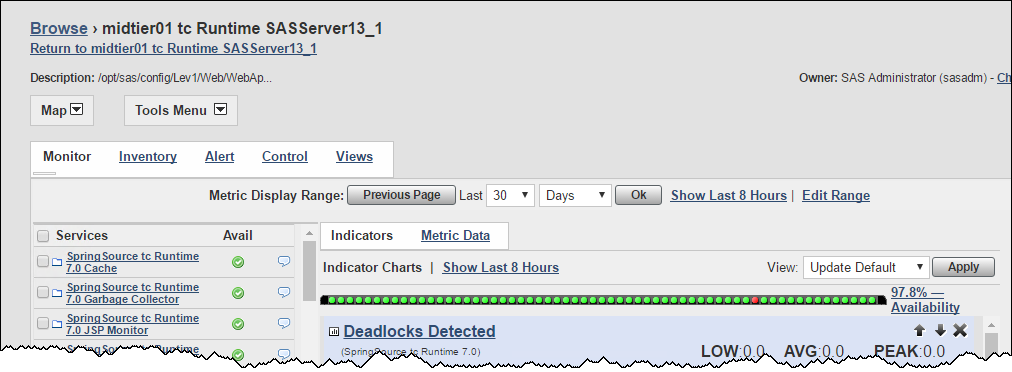

One very useful type of auditing for a SAS administrator is to have summary data about the availability and performance of various resources (platforms, servers, services) from the 30,000-foot view. $1000 loan guaranteed. Using SAS Environment Manager, it's easy to go in and look at the availability of any one resource over


Energy suppliers are fighting for prime position in the domestic energy supply market. Disillusioned customers, increased competition due to a flood of new entrants and tighter regulations are forcing suppliers to reassess their business models. According to UK regulator Ofgem, there were 3.8 million account switches in the first six


It was like any other day in autumn. The brightly covered leaves that had once been attached to the cascading tree branches had finally let go. The summer heat had taken its toll and there they were lying on the ground fading into the Earth’s surface. I remember looking out


Lately, the definitions of data governance and data management look very much alike. In this two-part series, we'll define data governance and data management. And we'll see that there's a big difference in the two.