All Posts


Most enterprises employ multiple analytical models in their business intelligence applications and decision-making processes. These analytical models include descriptive analytics that help the organization understand what has happened and what is happening now, predictive analytics that determine the probability of what will happen next, and prescriptive analytics that focus on
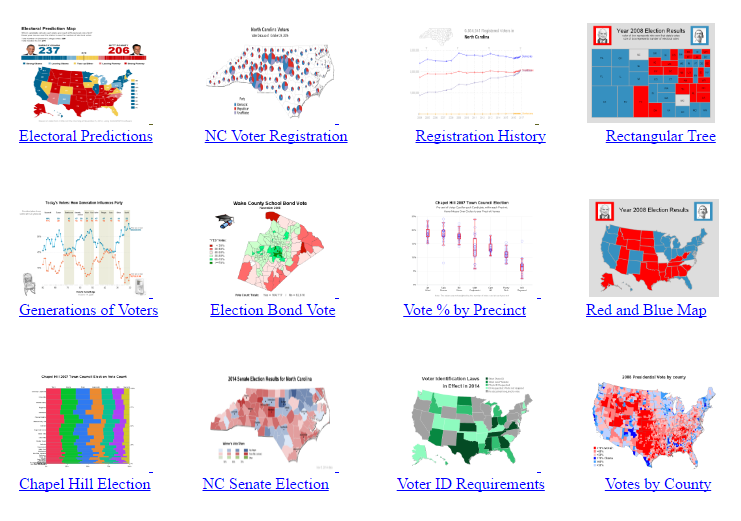

Elections in the US are a 'target rich environment' for data analysts. There are surveys and forecasts before the election, and the presentation of results during and after the voting. What's your favorite election-related graph of all time? For the current (2016) presidential election, my favorite graphs are on the


The digital age has fundamentally changed how brands and organisations interact with consumers. This shift has been a crucial part of the Third Industrial Revolution and helped spark the era of consumers sharing their data with different organisations. But now organisations are heralding the Fourth Industrial Revolution, and data is


My river walk last week turned into a spectacular fall show. But if it rains this week in San Antonio, like the weatherman predicts, what will I do? In the coming days, I’ll be presenting at two user groups, one in eastern Canada in Halifax, and the other all the


Electronic health records (EHRs) and the overall advancement of information technology have produced a tsunami of data that must be stored, managed and used. Some had naively hoped that EHRs would bring a simpler, more streamlined industry. Instead, we’re finding that the delivery and management of health care is more
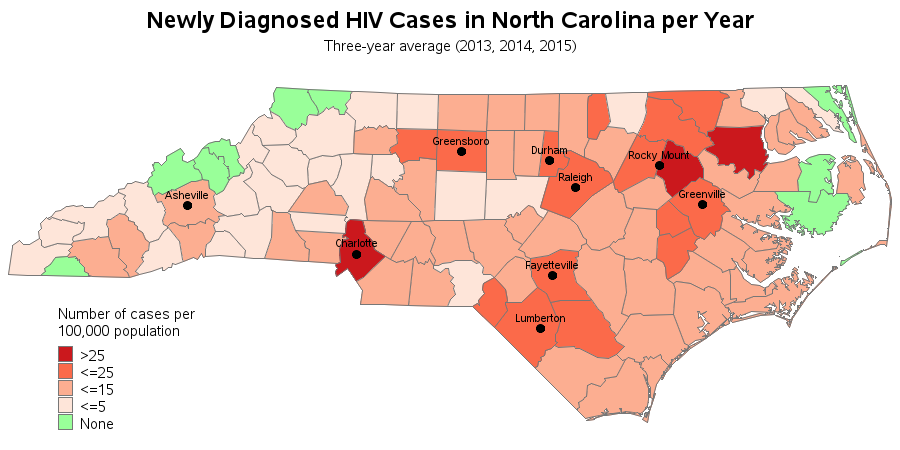
Being an Eagle Scout, the data for good movement caught my attention. I wondered if I could apply my computer skills in a way that might help. How about showing people better ways to visualize HIV/AIDS data - that might help doctors better understand the data, and therefore better treat


Actualmente, a nivel mundial los deportes generan ganancias estratosféricas, desde las propias entradas a los eventos y/o torneos, los múltiples contratos televisivos, patrocinios, souvenirs, hasta las marcas de ropa y calzado deportivo que han hecho de esta vertical de negocio una de las más rentables en los últimos tiempos. La
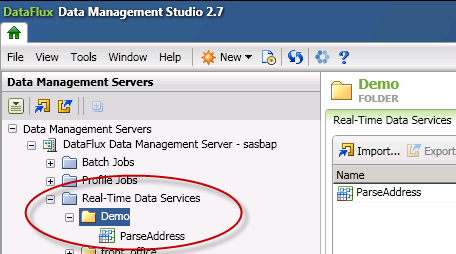

With DataFlux Data Management 2.7, the major component of SAS Data Quality and other SAS Data Management solutions, every job has a REST API automatically created once moved to the Data Management Server. This is a great feature and enables us to easily call Data Management jobs from programming languages

One request came in for the previous article on Circle link graph, for the addition of arrow heads to indicate the direction of the flow. Given that I am using a SERIES plot to render the links, it is relatively easy to add arrow heads to the links as the SERIES


.@philsimon says that even seemingly useless information can be useful under the right circumstances.


Everyone all sugared up? I remember the annual scene of Halloween night as my sister and I shed our costumes, poured our loot onto the living room floor and began the negotiations. Fortunately, I was partial to the chewy fruity candies and and she was partial to chocolate. The only chocolate bar I was

What would happen if we could ask any type of scientific or clinical question about patients, and then go out and find the data to answer our questions? With "real-world data," we can do just that. Real-world data is all medicinal product data that comes from real-life patients. In contrast,


Many people have the perception that data governance is all about policies and mandates, committees and paperwork, without any real "rubber on the road" impact. I want to dispel this viewpoint by sharing a simple example of how one company implemented data governance to enforce something practical that delivered long-term
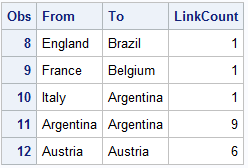
There has been some interest in "Circle Link Graph" diagrams where the nodes are laid out in a circle, with links going from one node in the circle to another. I recall seeing one diagram during the 2014 World Cup Soccer tournament, showing the number of players from one country that


Si usted está en Bogotá este 2 de noviembre y es uno de los invitados especiales de la Segunda Convención Latinoamericana de Analítica 'Analytics Everywhere', podrá saber cómo el Rey del Rock & Roll, el recursivo personaje de la TV y muchos otros personajes le dan 'otra mirada a la