All Posts

Cooperation and information sharing between tax authorities around the world can help ensure that taxpayers pay the right amount of tax to the right jurisdictions. The Common Reporting Standard (CRS) is an agreement between countries in the Organisation for Economic Co-operation and Development to collect and share data from their financial institutions annually. This remarkable achievement


There are several ways to buy data, and even more companies who are willing to sell it. By annual subscription or by the drink, third-party data vendors promise they can solve your identity theft and non-compliance problems. It’s as simple as signing a contract, and letting the data tap begin
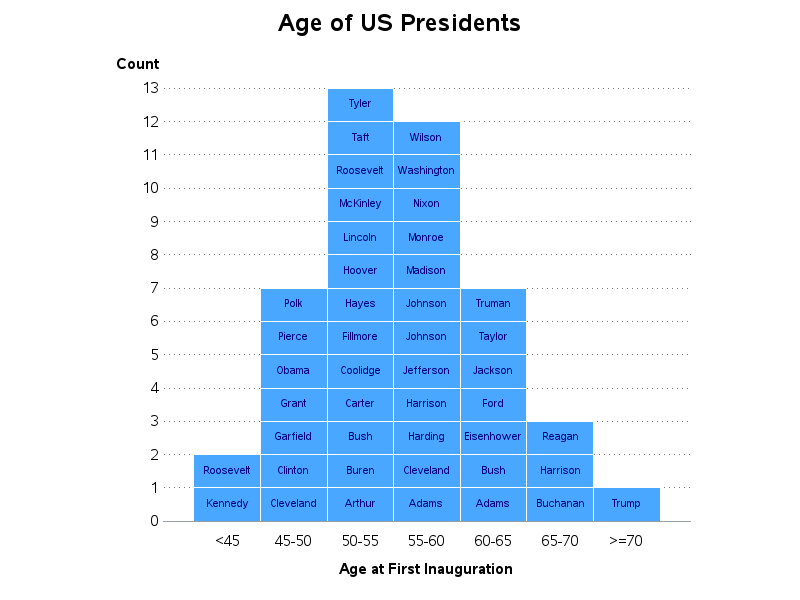

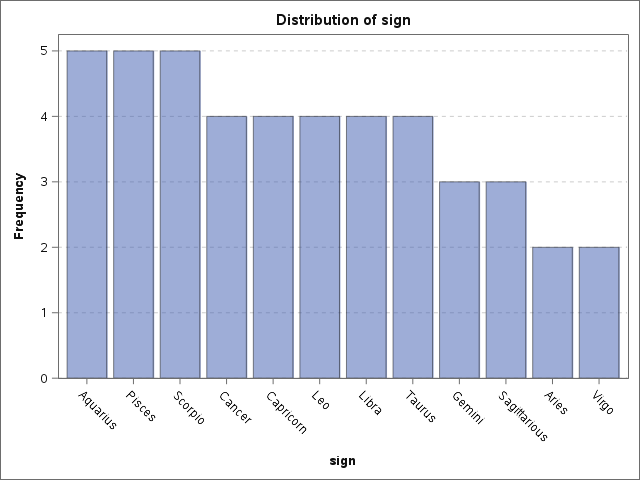
Recently, my fellow SAS blogger Rick Wicklin wrote a post showing how to graph the ages of all the US presidents. And Chris Hemedinger showed how to create a bar chart showing the number of presidents having each of the 12 zodiac signs. Both are interesting graphs, but I wanted to


At SAS, we've worked hard to transform ourselves into an analytical marketing organization. And it's an ongoing journey. As new tools and data sources appear, we'll continue to grow, change and improve. As the leader of this effort, I wish there had been a how-to guide available when we started


A hot button issue this election season was the need to determine the eligibility of people for various government programs like the Affordable Care Act (ACA), Medicare and Medicaid, or entry into the United States as a migrant refugee. “Look, we’re facing the worst refugee crisis since the end of


There are no limitations for what you can accomplish. That’s the message Keith Poston from the Friends of the North Carolina Museum of Natural Sciences imparted to 300 middle and high school students, teachers and parents assembled this week at the museum for the fourth STEM Career Showcase for Students


It's that time of year again where almost 50 million Americans travel home for Thanksgiving. We'll share a smorgasbord of turkey, stuffing and vegetables and discuss fun political topics, all to celebrate the ironic friendship between colonists and Native Americans. Being part Italian, my family augments the 20-pound turkey with pasta –


Una de las preocupaciones constantes de toda compañía es desarrollar un ROI (Retorno de Inversión) positivo, es decir, tener la certeza de que las acciones realizadas como parte de la estrategia de negocio serán rentables. Por ello, diversos organismos de innovación empresarial han decidido implementar herramientas que permiten a las

Are you the lone-wolf SAS programmer in your company - managing the data, performing the analyses, and graphing the output for everyone else? And what's the only format they all know how to work with, and wish they had your output in? Let's face it ... that's probably an Excel
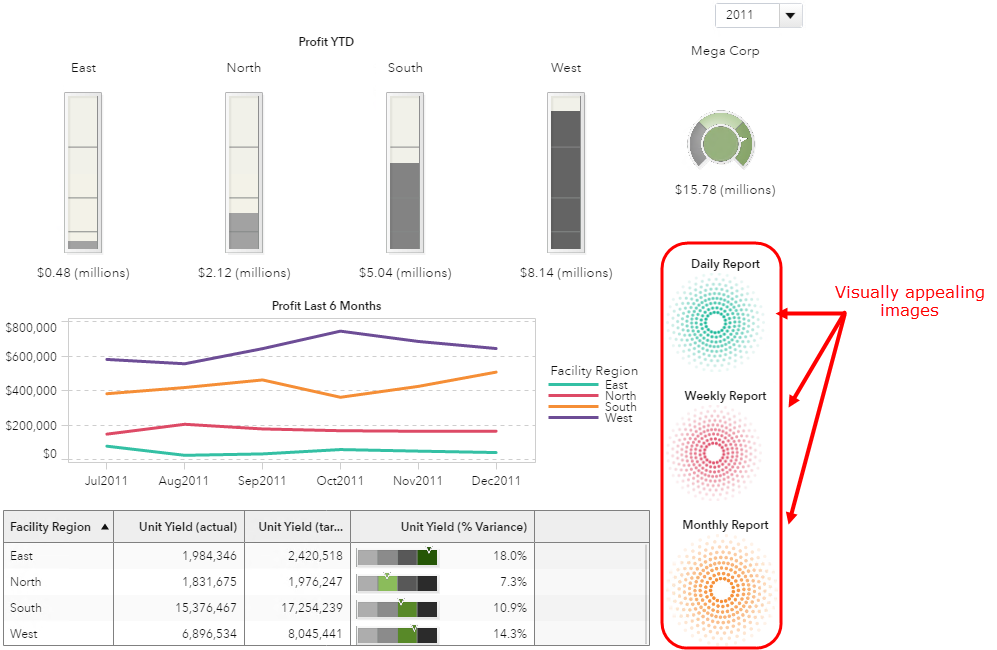

If your SAS Visual Analytics report requirements include linking out to separate reports without the need to pass values, you may want to consider using images to enhance the appearance of your base report. Here are three style examples using images that you can use depending on your report design

Rick Wicklin showed us how to visualize the ages of US Presidents at the time of their inaugurations. That's a pretty relevant thing to do, as the age of the incoming president can indirectly influence aspects of the president's term, thanks to health and generational factors. As part of his


International Fraud Awareness Week is here! I know, I know… Fraud Week is not quite as exciting as Shark Week. It doesn’t appeal to your taste buds like Restaurant Week. Nor does it have the quirky feel of Brain Awareness Week (nope… I’m not making that one up!!). Nevertheless, Fraud Week is


Criminal enterprises are tapping into the lucrative opioid business through creative schemes that are less likely to be identified as opioid abuse, misuse or diversion. One of the latest schemes? Auto insurance fraud. First, some background… While extensive progress has been made in establishing, improving, and mandating prescription drug monitoring


On June 22nd, the U.S. Department of Justice announced the largest Medicaid fraud bust in history. The National Health Care Fraud Takedown included 301 defendants charged, $900 million in false billings, 61 medical professionals and 29 doctors, across 36 states. In another case, investigators in New York uncovered more than

Currently, most fraud detection solutions for financial crime and tax fraud are focused on risk assessing entities. That is to say, they evaluate the risk of each individual or businesses separately. While this helps prioritize risk-based investigations by alerting investigators to the likelihood of fraud, it does not necessarily maximize deterrence.