One very useful type of auditing for a SAS administrator is to have summary data about the availability and performance of various resources (platforms, servers, services) from the 30,000-foot view. $1000 loan guaranteed. Using SAS Environment Manager, it's easy to go in and look at the availability of any one resource over various time spans--for the past few hours, past day, past week, or past month and more. This is a very powerful way to summarize how much of the time a given resource was "up and responsive."
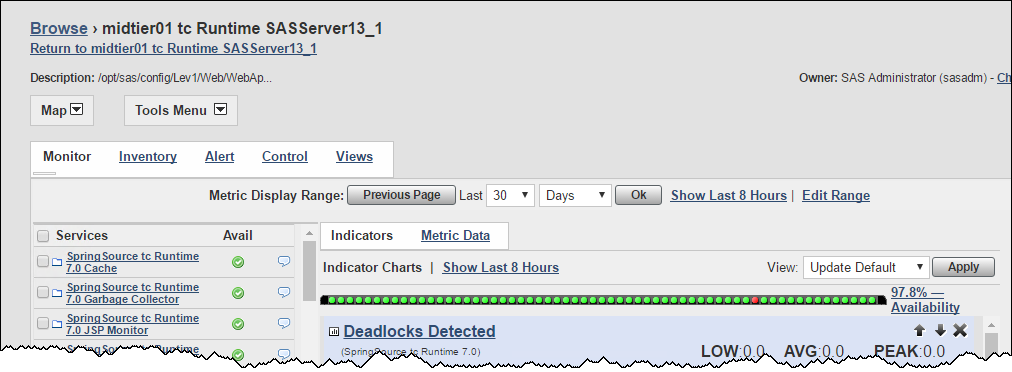
However, there's no way to see that type of information, or even a summary of that information, for all your servers at once микрозайм онлайн. A typical deployment will have anywhere from 10 to 50 or more different servers, and to view the availability of them all, over an extended period, you would have to visit and drill down each resource, one at a time.
To help answer this problem, I've developed a simple report that summarizes the availability for all servers. It uses two data sets that are automatically generated as part of the SAS Environment Manager Data Mart - availability and resourceinventory. It doesn't provide the hour-by-hour information like the Monitoring interface of SAS Environment Manager does, but it gives you a percent of time available, for each server, for either the past day, week, month, or even quarter, in one summary report (if you have the data for it). For a production environment, this could provide helpful "big-picture" information on availability.
Building the report will involve copying an existing report, used as a template, modifying a bit of the metadata for that report, and copying the SAS code that generates the report. The report uses a stored process to do the work.
Here's how to create the report.
1. Copy the SAS code provided here and save it in a local file:
If you are working on a remote machine, such as through Remote Desktop or mobaXterm, then upload the file to the machine running the metadata server so it will be available to copy into the report metadata.
2. Log into SAS Management Console as sasadm@saspw, the SAS administrator.
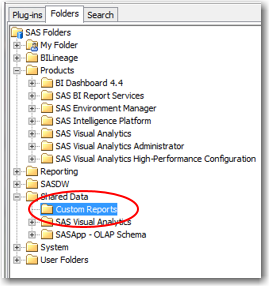
3. Select the Folders tab (upper left), right mouse on the Shared Data folder, select New->Folder, and name it Custom Reports:
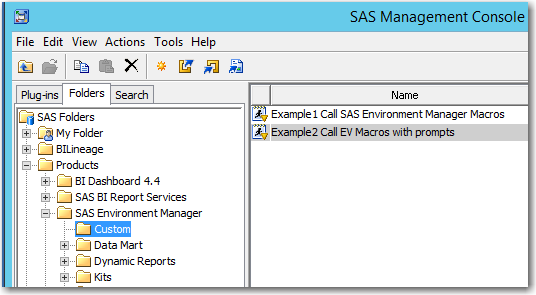
4. Navigate to the folder Products->SAS Environment Manager->Custom and locate the existing example report called Example 2 Call EV Macros with prompts.
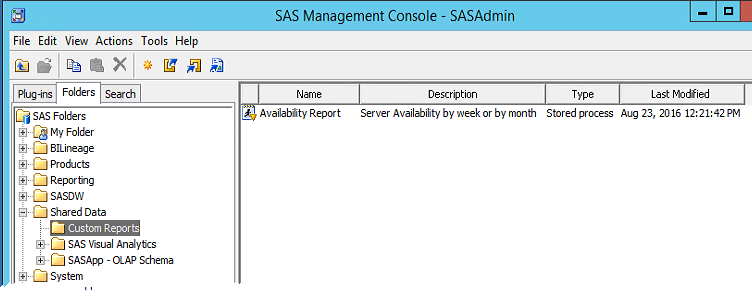
5. Copy the example report into the new Custom Reports folder created in Step 3 above, then use the right mouse menu to rename it to Availability Report. When complete, you will see the new folder and report inside it:
6. Select the new Availability Report, right mouse, select Properties.
7. On the General tab, specify Name, Description, and Keywords as shown:
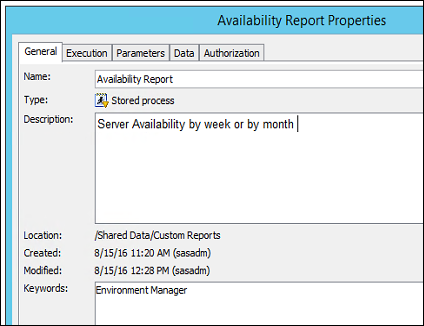
It's especially important to have the keywords "Environment Manager" in the Keywords field, so that the report will appear in the Report Center of Environment Manager.
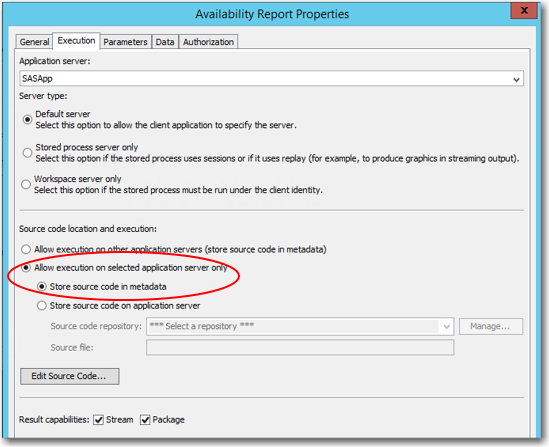
8. On the Execution tab, select your Application server, and below, specify Store source code in metadata. Then click the Edit Source Code... button:
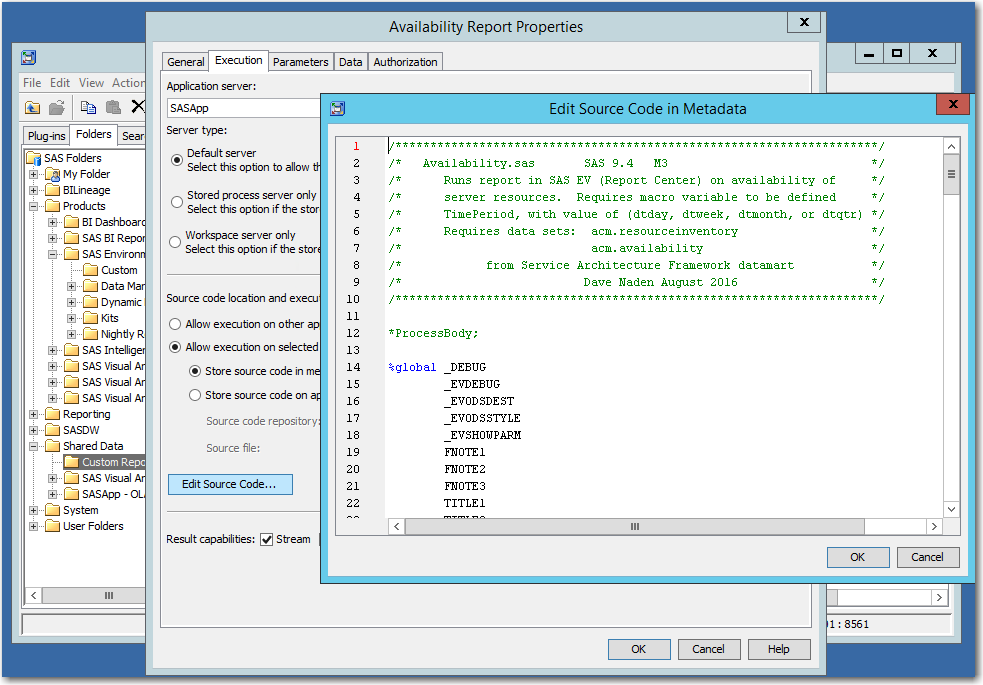
9. Copy/paste the SAS code (Step 1 above) into the source code window and click OK to save it.
10. On the Parameters tab, you'll see Titles and Footnotes, and Output Formats and Debugging. Select and Delete the Titles and Footnotes group; leave the Output Formats and Debugging group as is.
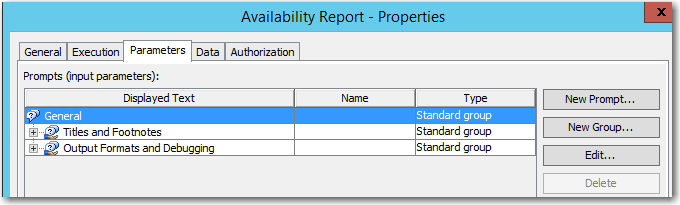
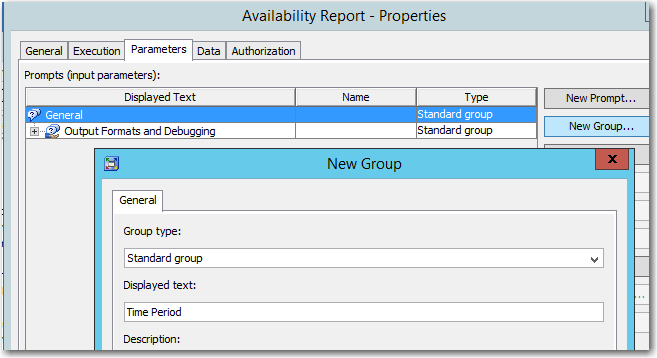
11. Select General, then click the New Group... button (right side), and specify:
Group type: Standard group
Displayed text: Time Period
Click OK button
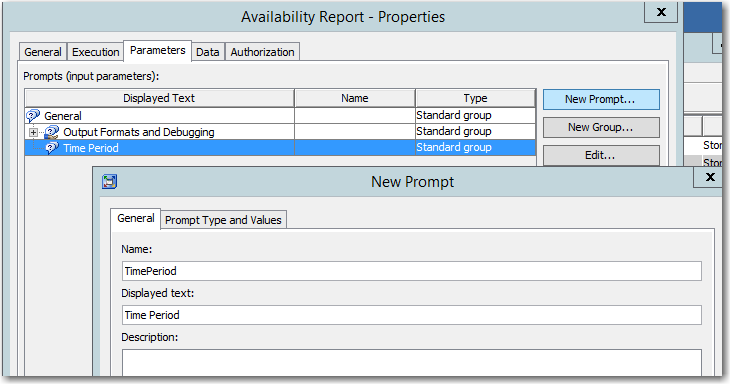
12. Select the new group, Time Period. Click the New Prompt button. Type the string "TimePeriod" (no space) in the Name field and “Time Period” in the Displayed Text field. Then click OK.
13. Select the new prompt TimePeriod, click the Edit button on the right side. Select the Prompt Type and Values tab at the top. On the Edit Prompt screen, specify:
Prompt type: Text
Method for populating prompt: User selects values from a static list
Number of values: Single value
Use the Add button (right side) to insert the following four choices shown below:

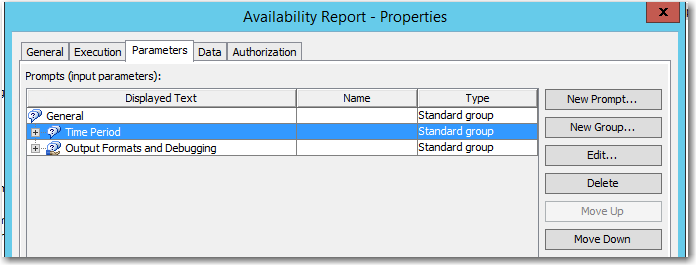
Set the "week" value as the default as shown. Click the OK button. Now, select the new Time Period prompt and click the Move Up button (right side), so that the Time Period prompt appears first:
If desired, you can try the Test Prompts button to make sure your prompts are correct. Click OK again to save all changes.
14. Test the new report:
Log into SAS Environment Manager as an administrator and go to the Report Center. Open the Shared Data / Custom Reports folder and find the new report "Availability Report." (If you were already logged into Environment Manager, you have to log out/log in again to pick up the new metadata.)
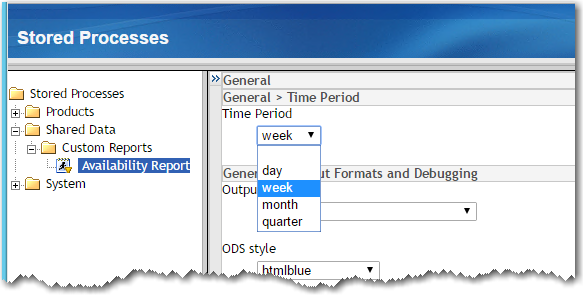
Notice that you have the custom prompt for Time Period , where you can choose either "day," "week," "month" or "quarter" for the time window, and the standard prompt for Outputting Styles and Logging and Debugging settings. Click the Run button at the bottom, and you should see your new report, similar to this: (Yellow indicates any percent less than 100.)
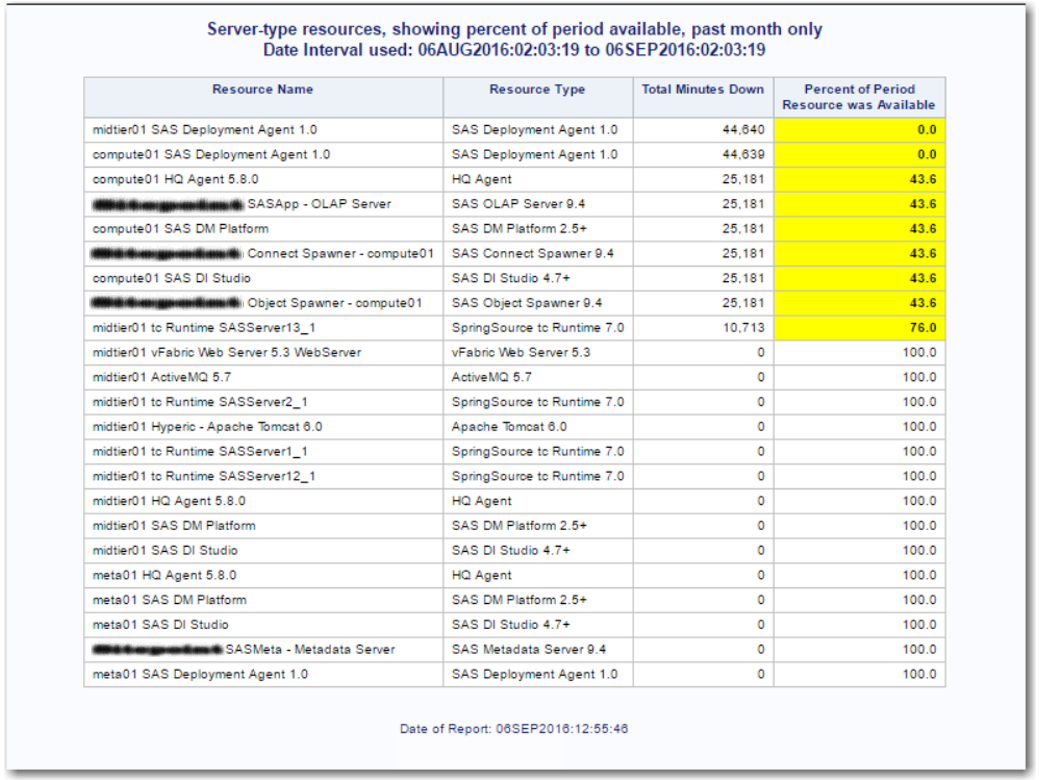
You can install this report for any site with the SAS Environment Manager Data Mart active and have it running in just a few minutes. You could pull the SAS code from it and create your own scheduled run, weekly or monthly, as a means to help to evaluate a deployment for reliability.
A few cautions are in order:
- You need to have at least some data in your data mart in order to run this report. If you don't have enough data to cover the time period that you request, you will get an error message.
- The data this report provides is summary level, so if you find one or more servers
that have been down a significant amount of time, the next step would be to use the SAS Environment Manager to focus in on those troubled resources and examine exactly WHEN they were down, for exactly how long, how many times they were down, and/or look at other metrics on those resources as a way to ascertain causes. - This is a simple program without much error checking. However, you can specify in the parameters to see the SAS log, which should enable you to debug it should issues occur. And of course feel free to enhance it or add to it!
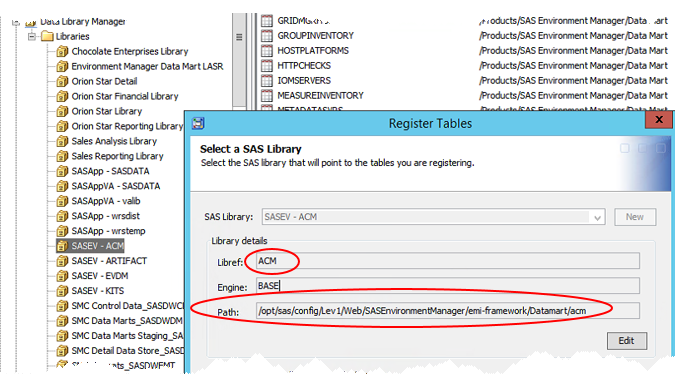
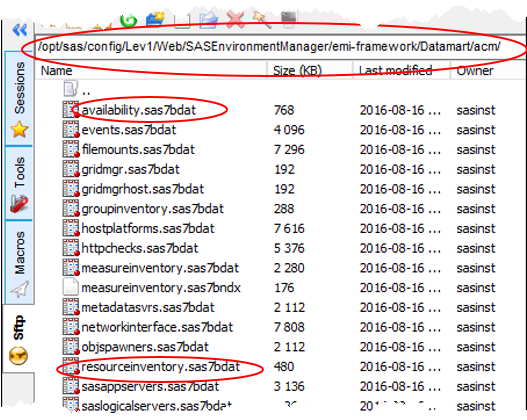
One easy check you can do by hand is to verify the existence of the data sets being used, and that the libref used, ACM, has been defined. This is what they looked like on my compute machine, where the SAS Environment Manager Service Architecture was installed:
For additional insight on how you can use SAS Environment Manger and the report center to analyze the "big picture" on a SAS deployment's availability, check out this YouTube video.
SAS code referenced above.
/*********************************************************************/ /* Availability.sas SAS 9.4 M3 */ /* Runs report in SAS EV (Report Center) on availability of */ /* server resources. Requires macro variable to be defined */ /* TimePeriod, with value of (dtday, dtweek, dtmonth, or dtqtr) */ /* Requires data sets: acm.resourceinventory */ /* acm.availability */ /* from Service Architecture Framework datamart */ /* Dave Naden August 2016 */ /*********************************************************************/ *ProcessBody; %global _DEBUG _EVDEBUG _EVODSDEST _EVODSSTYLE _EVSHOWPARM FNOTE1 FNOTE2 FNOTE3 TITLE1 TITLE2; %evdm_kickstart(); %include "&SASEVCONFIGDIR/Datamart/EVDMAUTOEXEC_STP.sas"; ods _ALL_ CLOSE; %evodssetopt(evdest=&_evodsdest,style=&_evodsstyle); %evgopts; %evspinit; %ev_promptselects(varname=_debug); %let evbegin=%ev_startdate(%sysfunc(date()),-10); %let evend=%sysfunc(datetime(),datetime.); %let period=&TimePeriod; /* can be dtday, dtweek, dtmonth, or dtqtr */ %STPBEGIN; %macro available; /* get the resource IDs for servers only */ data servers; set acm.resourceinventory(keep=id name type invLevel); if (invlevel = "SERVER"); /* remove a few servers that are not really servers */ realserver = 1; if (index(type,"Directory") > 0) then realserver = 0; if (index(type,"Data Mart") > 0) then realserver = 0; if (index(type,"Server Context") > 0) then realserver = 0; if (index(type,"System Info") > 0) then realserver = 0; if (realserver) then output; rename id = resource_id; proc sort data=servers; by resource_id; /* get availability data, prepare for merge */ proc sort data = acm.availability(keep=resource_id name avail starttime endtime minutes) out=avail; by resource_id; /* keep data only if it's server data, and if there's any records */ /* in the availability data set */ data avail; merge servers(in=a) avail; by resource_id; format now datetime24. ; if (a) and (avail ne .) ; /* get maximum (most recent) endtime */ proc summary data=avail; output out=timewindow(rename=(endtime=maxendtime)) max=; var endtime; /* Get earliest start time for this data set */ proc summary data=avail; output out=earliesttime(rename=(starttime=earliest)) min=; var starttime; %let enoughdata=1; /* establish the time window for report requested, and check whether */ /* data goes back far enough to run the report. If not, set flag */ data timewindow; set timewindow ; set earliesttime; period = symget('period'); begintime = intnx(period,maxendtime,-1,'S'); format begintime datetime24. ; totalminutes = intck('DTMINUTES',begintime,maxendtime,'C'); if (earliest > begintime) then call symput('enoughdata','0'); run; /* subset data set to include only records within that time window requested */ %if &enoughdata %then %do; data avail; if (_N_ = 1) then set timewindow; set avail; if (endtime < begintime) then delete; /* aggregate to resource level (server), calculate percent available */ data avail(keep=name type resource_id minutesdown percentup ); set avail; by resource_id; retain minutesdown; if first.resource_id then minutesdown=0; if (avail < 1) then do; if (starttime < begintime) then do; /* get number of minutes between begintime and endtime */ minutes = intck('DTMINUTES',begintime,endtime,'C'); end; minutesdown = minutesdown + minutes; end; if last.resource_id then do; if (minutesdown = 0) then percentup = 100; else percentup = ((totalminutes - minutesdown) / totalminutes) * 100; output; end; call symput("begintime",put(begintime,datetime24.)); call symput("maxendtime", put(maxendtime,datetime24.)) ; call symput ("currentdatetime",put(datetime(),datetime24.)) ; %let period = %substr(&period,3); proc sort data=avail; by percentup; proc report data=avail center split="*"; title "Server-type resources, showing percent up time up, past &period only"; title2 "Date Interval used: &begintime to &maxendtime "; footnote "Date of Report: &currentdatetime "; column name type minutesdown percentup; compute percentup; if percentup.sum<100 then call define(_col_, "style", "style=[backgroundcolor=yellow fontfamily=helvetica fontweight=bold]"); endcomp; label name='Resource Name' type='Resource Type' minutesdown='Total Minutes Down' percentup='Percent of Period *Resource was Available' ; format minutesdown comma6.0 percentup 5.1 ; run; %end; %else %do; data _null_ ; file print; put "Your data set does not have enough data for the report requested"; put "Specify a shorter time period"; run; %end; %mend available; %available; %stpend; |
Note: All code examples are provided as is, without warranty of any kind, either express or implied, including but not limited to the implied warranties of merchantability and fitness for a particular purpose. Recipients acknowledge and agree that SAS Institute shall not be liable for any damages whatsoever arising out of their use of this material. In addition, SAS Institute will provide no support for the materials contained herein.

4 Comments
I can't find the SAS Environmet Manager folder in the Console Manger -> Product , at the 9.4 version, this folder resides in other? In the SAS Intelligence Platform folder I did find a store process template, Can I make a copy of this and make the changes in there to get this type of report?
Please check the code again. I believe it is all there now.
Larry LaRusso, SAS User Blog Editor
Hello Larry LaRusso,
Thank you for sharing this SAS program. We have configured this code on our environment. However only day and week time period works fine.
Do you have any idea how we can troubleshoot this issue for month ?
Thanks in advance.
The SAS code reference provided does not appear to be complete. Hopefully this code is available somewhere else.