All Posts


Platform and strategy are core to compliance, but Jim Harris says commitment from people across the organization is just as important and harder to achieve.


After reading my article about how to use BY-group processing to run 1000 regression models, a SAS programmer asked whether it is possible to reorder the output of a BY-group analysis. The answer is yes: you can use the DOCUMENT procedure to replay a portion of your output in any


We like to think of analytics as a logical discipline, where investment decisions are consistently rational and predictable. Not so. Customer organisations are driven by all the usual complex and sometimes contradictory forces. Business users want analytics to help them make good customer facing decisions as quickly as possible, while


The Obama administration made great strides in improving the government’s use of information technology over the past eight years, and now it's up to the Trump administration to expand upon it. Let’s look at five possible Trump administration initiatives that can take government’s use of information technology to the next


Strengthens arms, wrists, core, spine and thighs. Opens chest and shoulders while improving posture. Upward-Facing Dog Pose (Sanskrit: Urdhva Mukha Svanasana) Begin lying down on mat (face down). Legs are lengthened behind with inner thighs spiraling so all ten toes and top of feet are planted in mat. Place palms
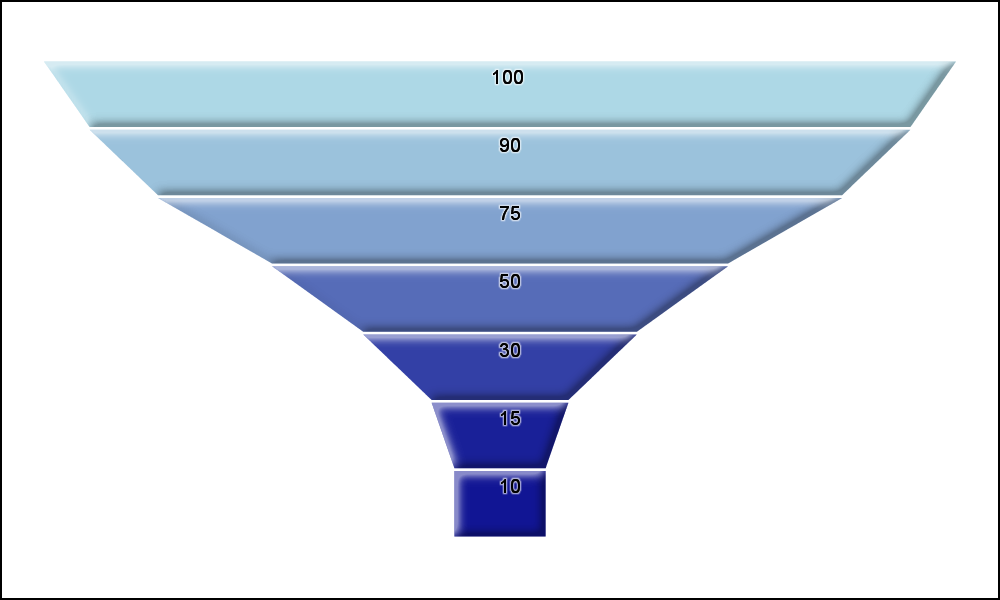

Funnel graphs are useful to track the number of visitors passing through various pages of a website or the number of patients in a study. The graph shows visually the retention of users or subjects in a study across levels of a marketing cycle or the study. One common representation


There aren’t many things that keep me awake at night but let me share a recent example with you. I’ve been grappling with how to help a local SAS team respond to a customer’s request for a “generic enterprise analytics architecture.” As background, this customer organization had recently embarked on


Word on the proverbial technology street is that online learning is ideal for modern learners, and, at SAS, we wholeheartedly agree. In 2016, more than 80,000 SAS users trained in an online or blended learning format. In 2017, we kicked off the year with the announcement of our new SAS


Editor's note: The following post is from Emma Warrillow, Chief DiGGer at Data Insight Group Inc. (DiG). Emma is a featured speaker at SAS Global Forum 2017 and recently named as one of the Top Women in Direct Marketing by Direct Marketing News. Learn more about Emma. “I need


David Loshin describes three sets of policies required for ensuring compliance with data protection directives for health care.


¿Se ha preguntado de qué manera la inteligencia artificial puede realzar la interacción con sus clientes? Es probable que lo haya hecho de varias maneras y utilizando conceptos similares, con respuestas muy variadas. Por ahora, comencemos por el principio, ¿qué es la inteligencia digital y cómo puede ayudar a su


A common request we receive about SAS Global Certification practice exams is to make them as close as possible to the actual exams so that future test takers get a more accurate feel for the overall exam experience. Good news. Our new practice exams come as close to the “real thing”


Editor's note (4/11/17): Full proceedings from SAS Global Forum 2017 (including for the presentations mentioned in this blog) can be found at http://support.sas.com/resources/papers/proceedings17/. SAS Global Forum 2017 is just a month away and, if you’re a SAS administrator, it’s a great place to meet your peers, share your experiences and attend
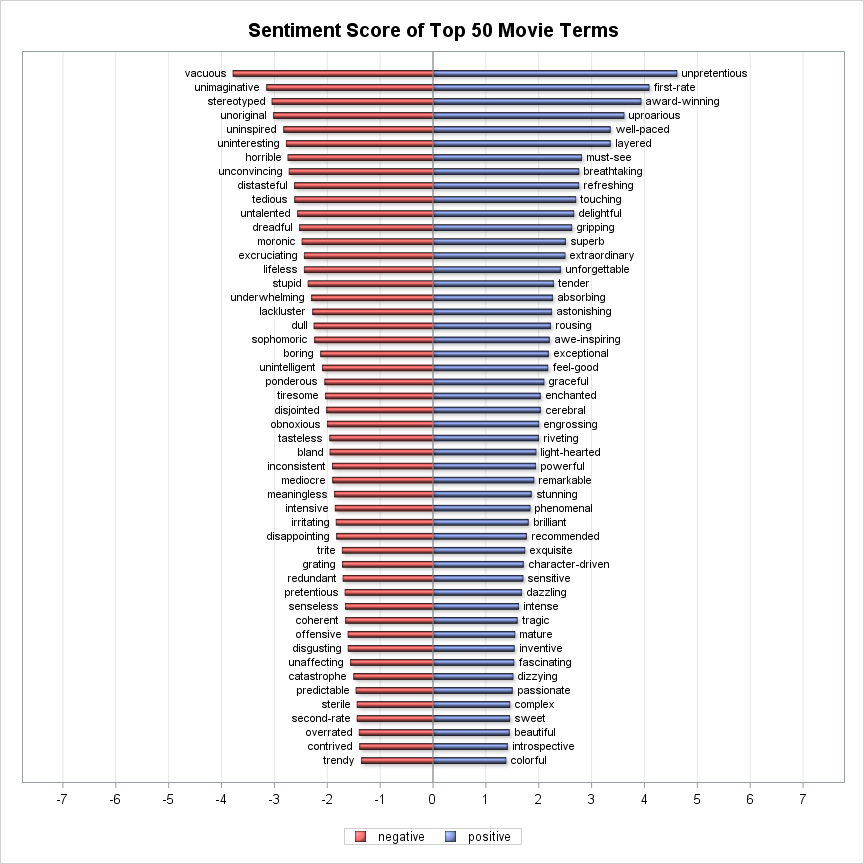

In 2011, Loughran and McDonald applied a general sentiment word list to accounting and finance topics, and this led to a high rate of misclassification. They found that about three-fourths of the negative words in the Harvard IV TagNeg dictionary of negative words are typically not negative in a financial


.@philsimon raises some chilling questions about the IoT and current threats.