All Posts


Success in the retail space boils down to one simple function: the conversion of sales. However, retailers can only do this if they have stock readily available. Missing a sales opportunity due to poor stock management just won’t cut it in today’s marketplace. How can we resolve this basic problem


Emma Warrillow, President of Data Insight Group, Inc., believes analysts add business value when they ask questions of the business, the data and the approach. “Don’t be an order taker,” she said. Warrillow held to her promise that attendees wouldn’t see a stitch of SAS programming code in her session
In an industry full of word people, it's not uncommon to hear journalists lament, “Data, what are you doing here!?” But today, data is a tool in the newsroom, and reporters often need to know how to analyze and present data to readers as part of their role in communicating information to the public.


I have a pet peeve. When folks I barely know ask me to write them a letter of recommendation or reference. I say no when I feel that my sense of personal integrity would be compromised in the process. With youth, I don’t say no right away. I use it
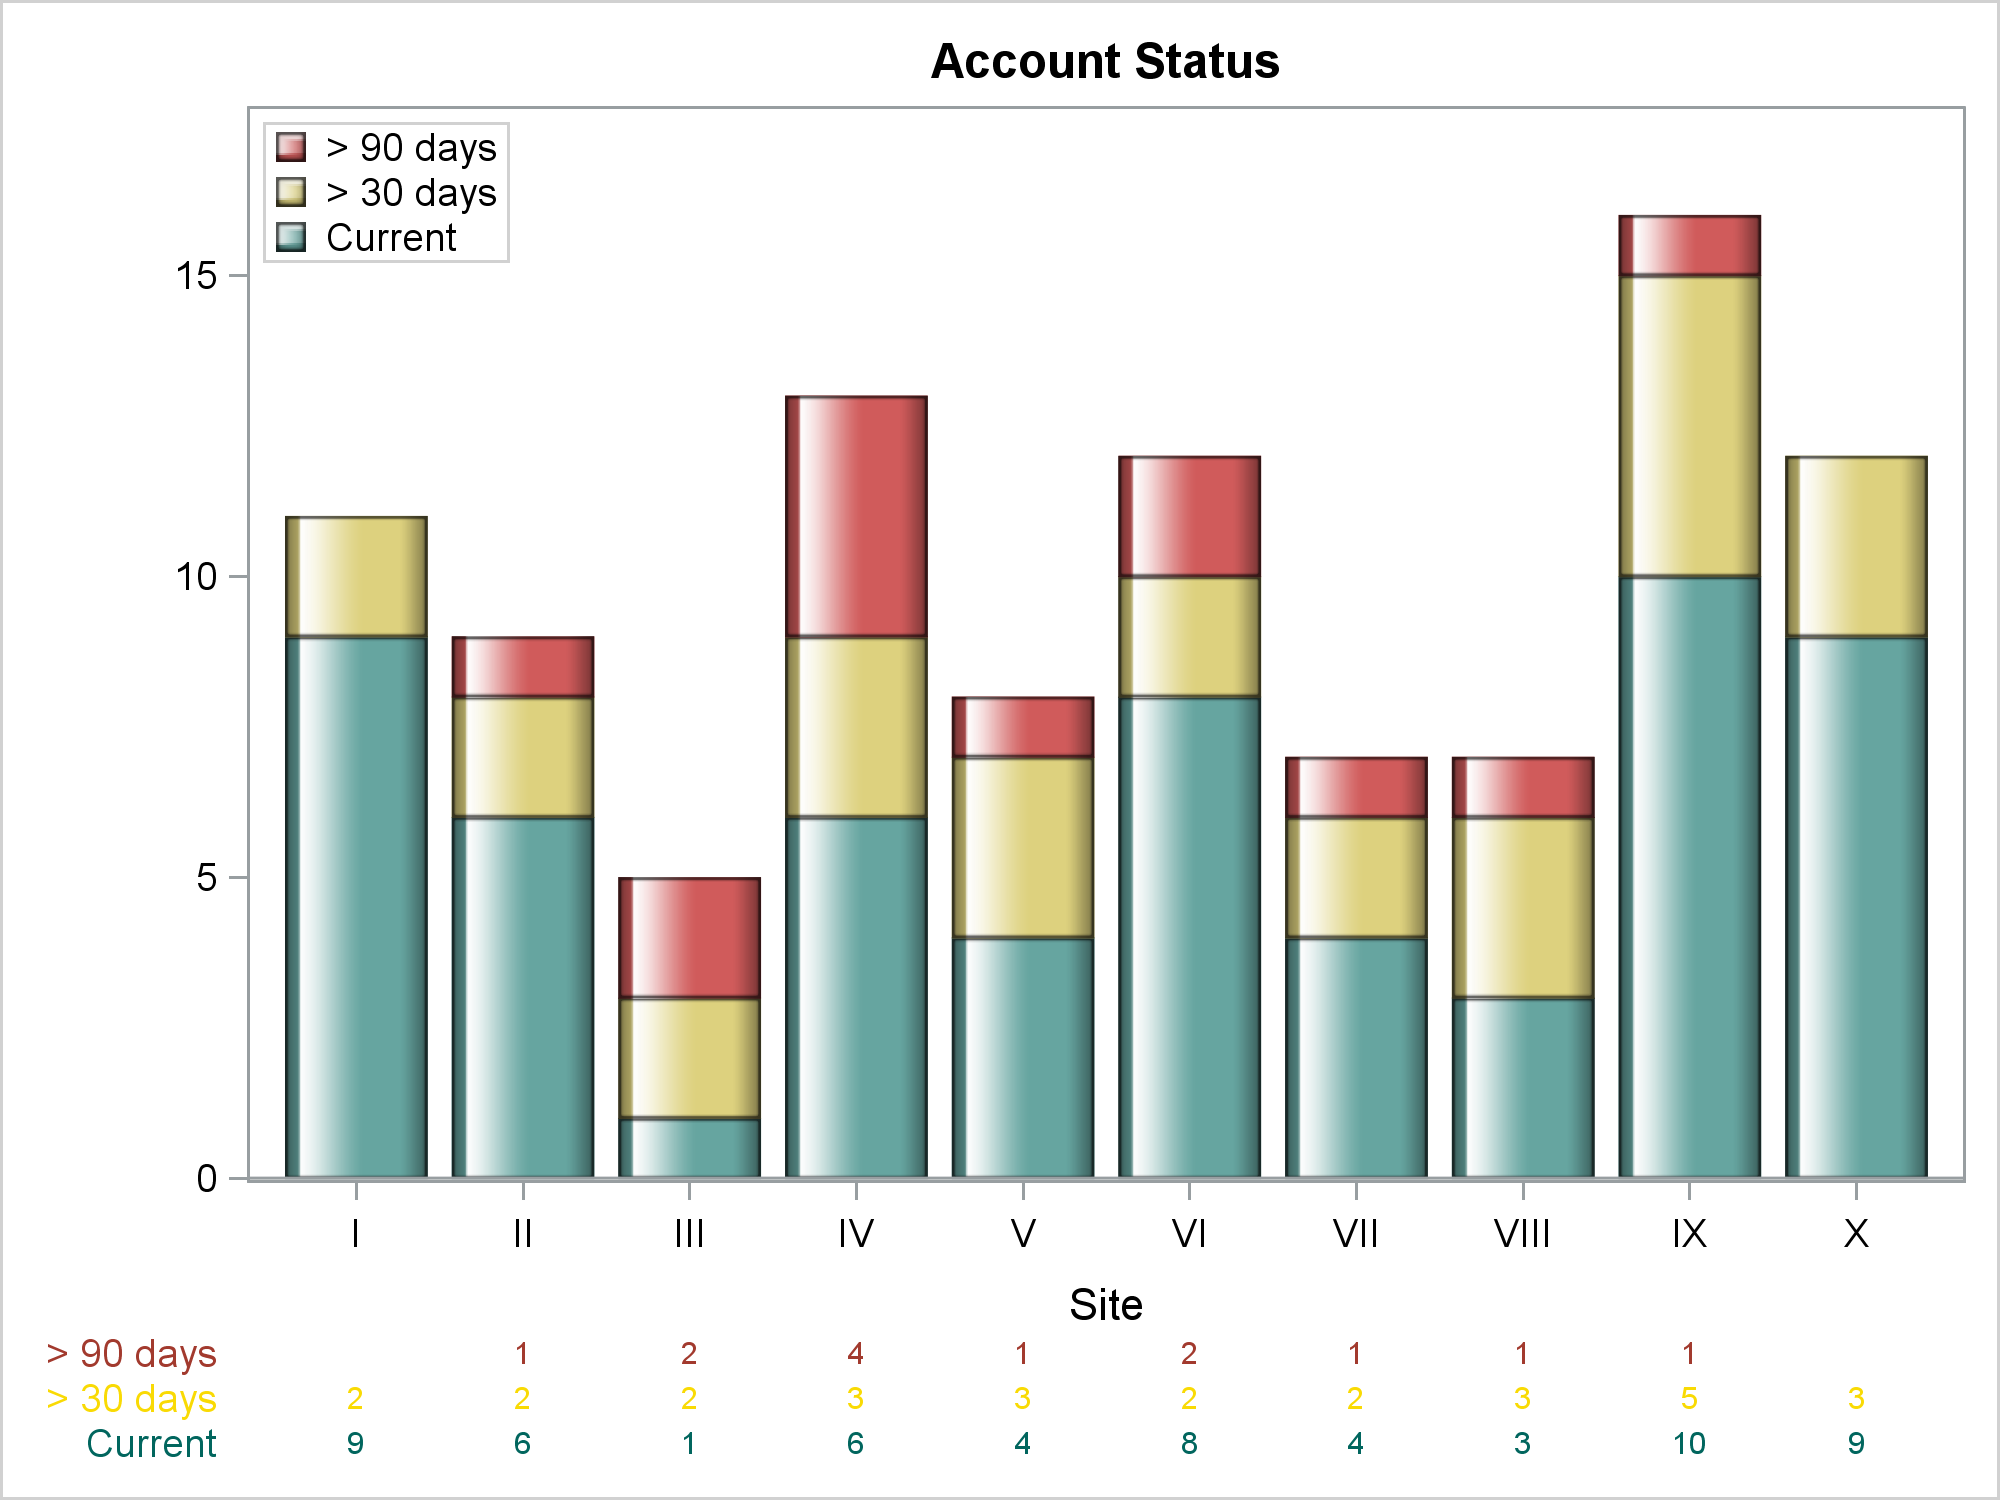

This post shows you how to make a bar chart and an X-axis table; ensure consistency in the order of the legend, bar subgroups, and axis table rows; coordinate the colors for each of those components; and drive all the color choices from an attribute map.


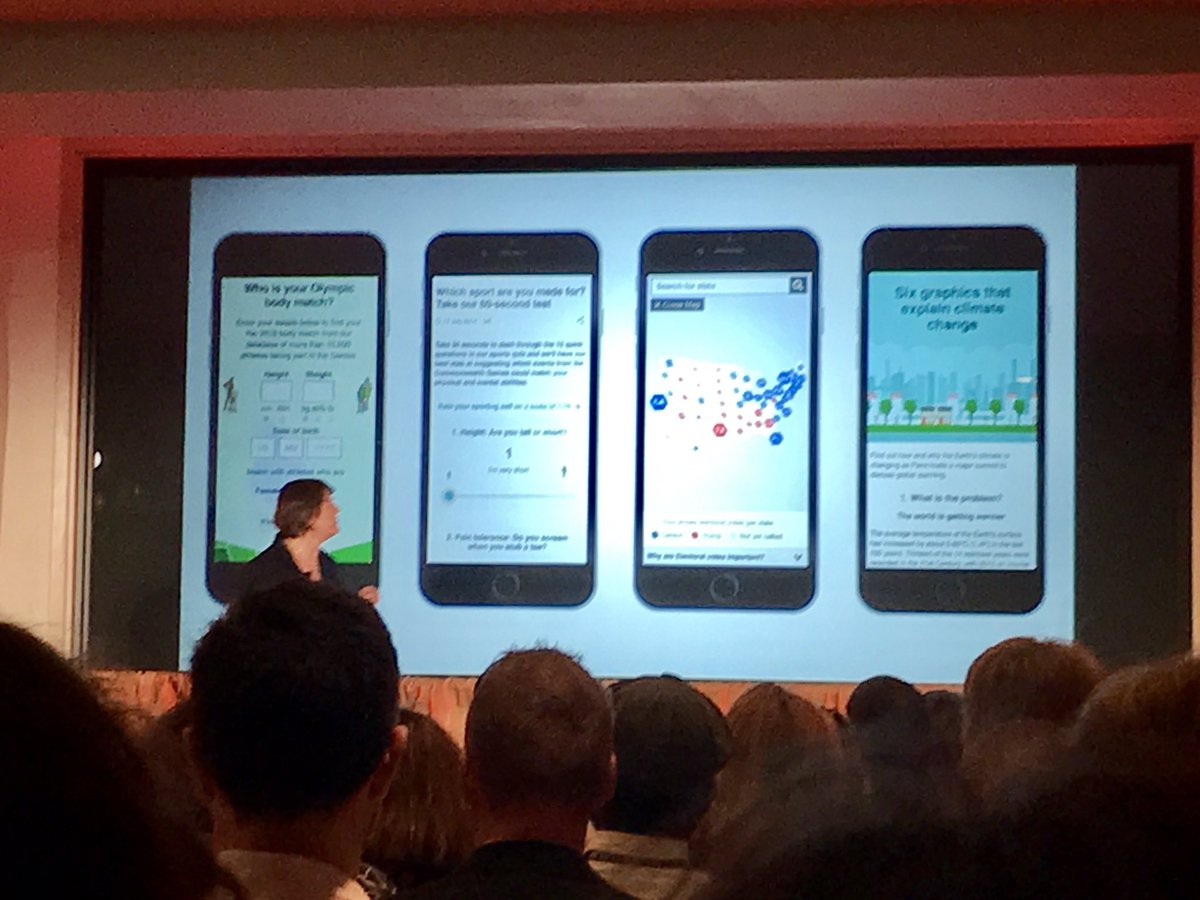
Two minutes in, I knew the 2017 SAS Global Forum Technology Connection would not be typical or average. For one thing, it was SAS Chief Technology Officer Oliver Schabenberger's show, and nothing he does is ever typical or average. The first surprise of the morning was his entrance. He zoomed onto the stage on a Segway, using slight


Opening Day is here! Every game experience at the ball park is memorable for my family. I'm excited to smell the fresh popcorn and peanuts. I love holding cold drinks in hopes of catching a foul ball with my cup. I’m anxious to see my team’s new prospects in action


Unable to attend SAS Global Forum 2017 happening now in Orlando? We’ve got you covered! You can view live stream video from the conference, and check back here for important news from the conference, starting with the highlights from last night’s Opening Session. While the location and record attendance made


What is SAS Global Forum if it isn't a conference that celebrates the ways that individuals can make a difference with data and analytics? Indeed, one of my favorite tweets from last night's opening session said: If the keynote sessions were just video biographies about how data people matter I would


Analise Polsky says analytics success for midsize business depends on getting the basics right and maintaining a data focus.


Operators of transmission networks and wholesale electric markets – ISOs (Independent System Operator) and RTOs (Regional Transmission Organizations) – have undergone sweeping changes in recent years, and the pace won’t be letting up anytime soon. With opportunities ranging from the growth of renewables to newly data-rich operating environments, and challenges


Want to strengthen your chest and triceps with one exercise? Check out these variations of the chest press. The chest press relies on strength and stability, and it's not just for Mondays. Choose one arm, both arms, decline, incline, or all options as you focus on maintaining a neutral spine with


One of the advantages of the new mixed-type tables in SAS/IML 14.2 (released with SAS 9.4m4) is the greatly enhanced printing functionality. You can control which rows and columns are printed, specify formats for individual columns, and even use templates to completely customize how tables are printed. Printing a table


여러분, SAS 무료 이러닝 사이트를 알고 계시나요? SAS 소프트웨어를 사용하는 고객들께서는 본사의 영문 e러닝을 무료로 활용할 수 있습니다. 먼저 SAS 홈페이지에서 ID와 PW를 만든 후 https://support.sas.com/edu/viewmyelearn.html 로 접속하여 로그인 해주세요. 그럼 아래와 같은 Product 코드 입력창이 나타나게 됩니다. 2. 가지고 계시는 SAS 라이센스를 클릭 하시면 아래와 같이 setnumid라는 숫자가 있습니다. 3. 위 코드 입력 창에 대문자 G와 setnumid를


Security analytics has gotten a lot of attention in the industry the last few years. That’s not surprising. After all, security analytics can help organizations: Transition from reactive threat firefighting to proactive security risk management. Exploit all available security data to develop better insights and priorities. Maximize the effectiveness of