All Posts
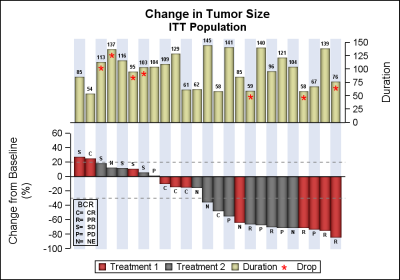

Waterfall plots have gained in popularity as a means to visualize the change in tumor size for subjects in a study. The graph displays the reduction in tumor size in ascending order with the subjects with the most reduction on the right. Each subject is represented by a bar classified by
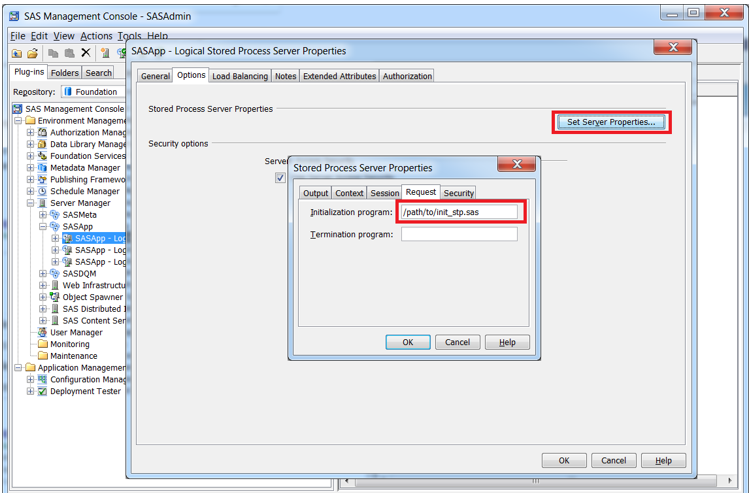

Recently, I was working with a client who had a unique problem. He needed a way to cancel a stored process from executing in cases where the stored process wasn’t registered to the matching Metadata folder-structure for its selected server context. For example, if a stored process was stored under


I hate my title, but I’m going to stick with it. In spite of it, I hope I can encourage you to pay attention to the current automation revolution and actively contribute to augmention-fueled innovation. If everyone understands those terms and actively tries to stay on top of how they
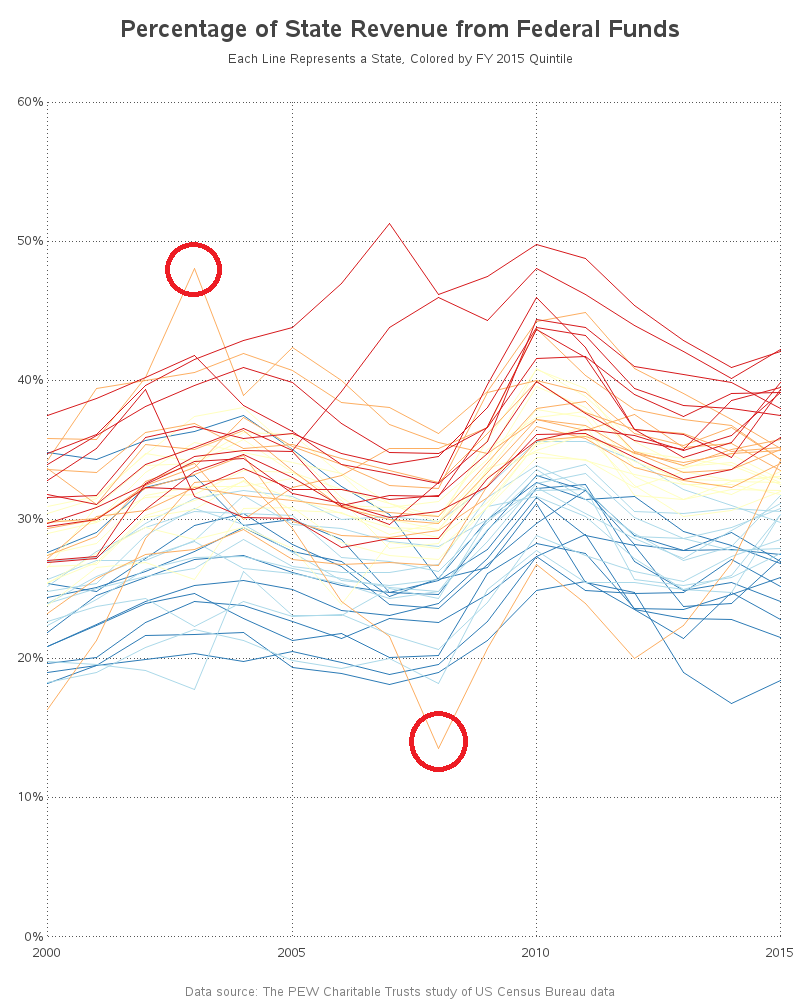

I recently saw an interesting PEW study showing the percent of each state's revenue that came from federal funds. They had some pretty nice graphs ... but just like jell-o, there's always room for more graphs, eh! Let's start with the map. Their map had an informative title, a reasonable gradient
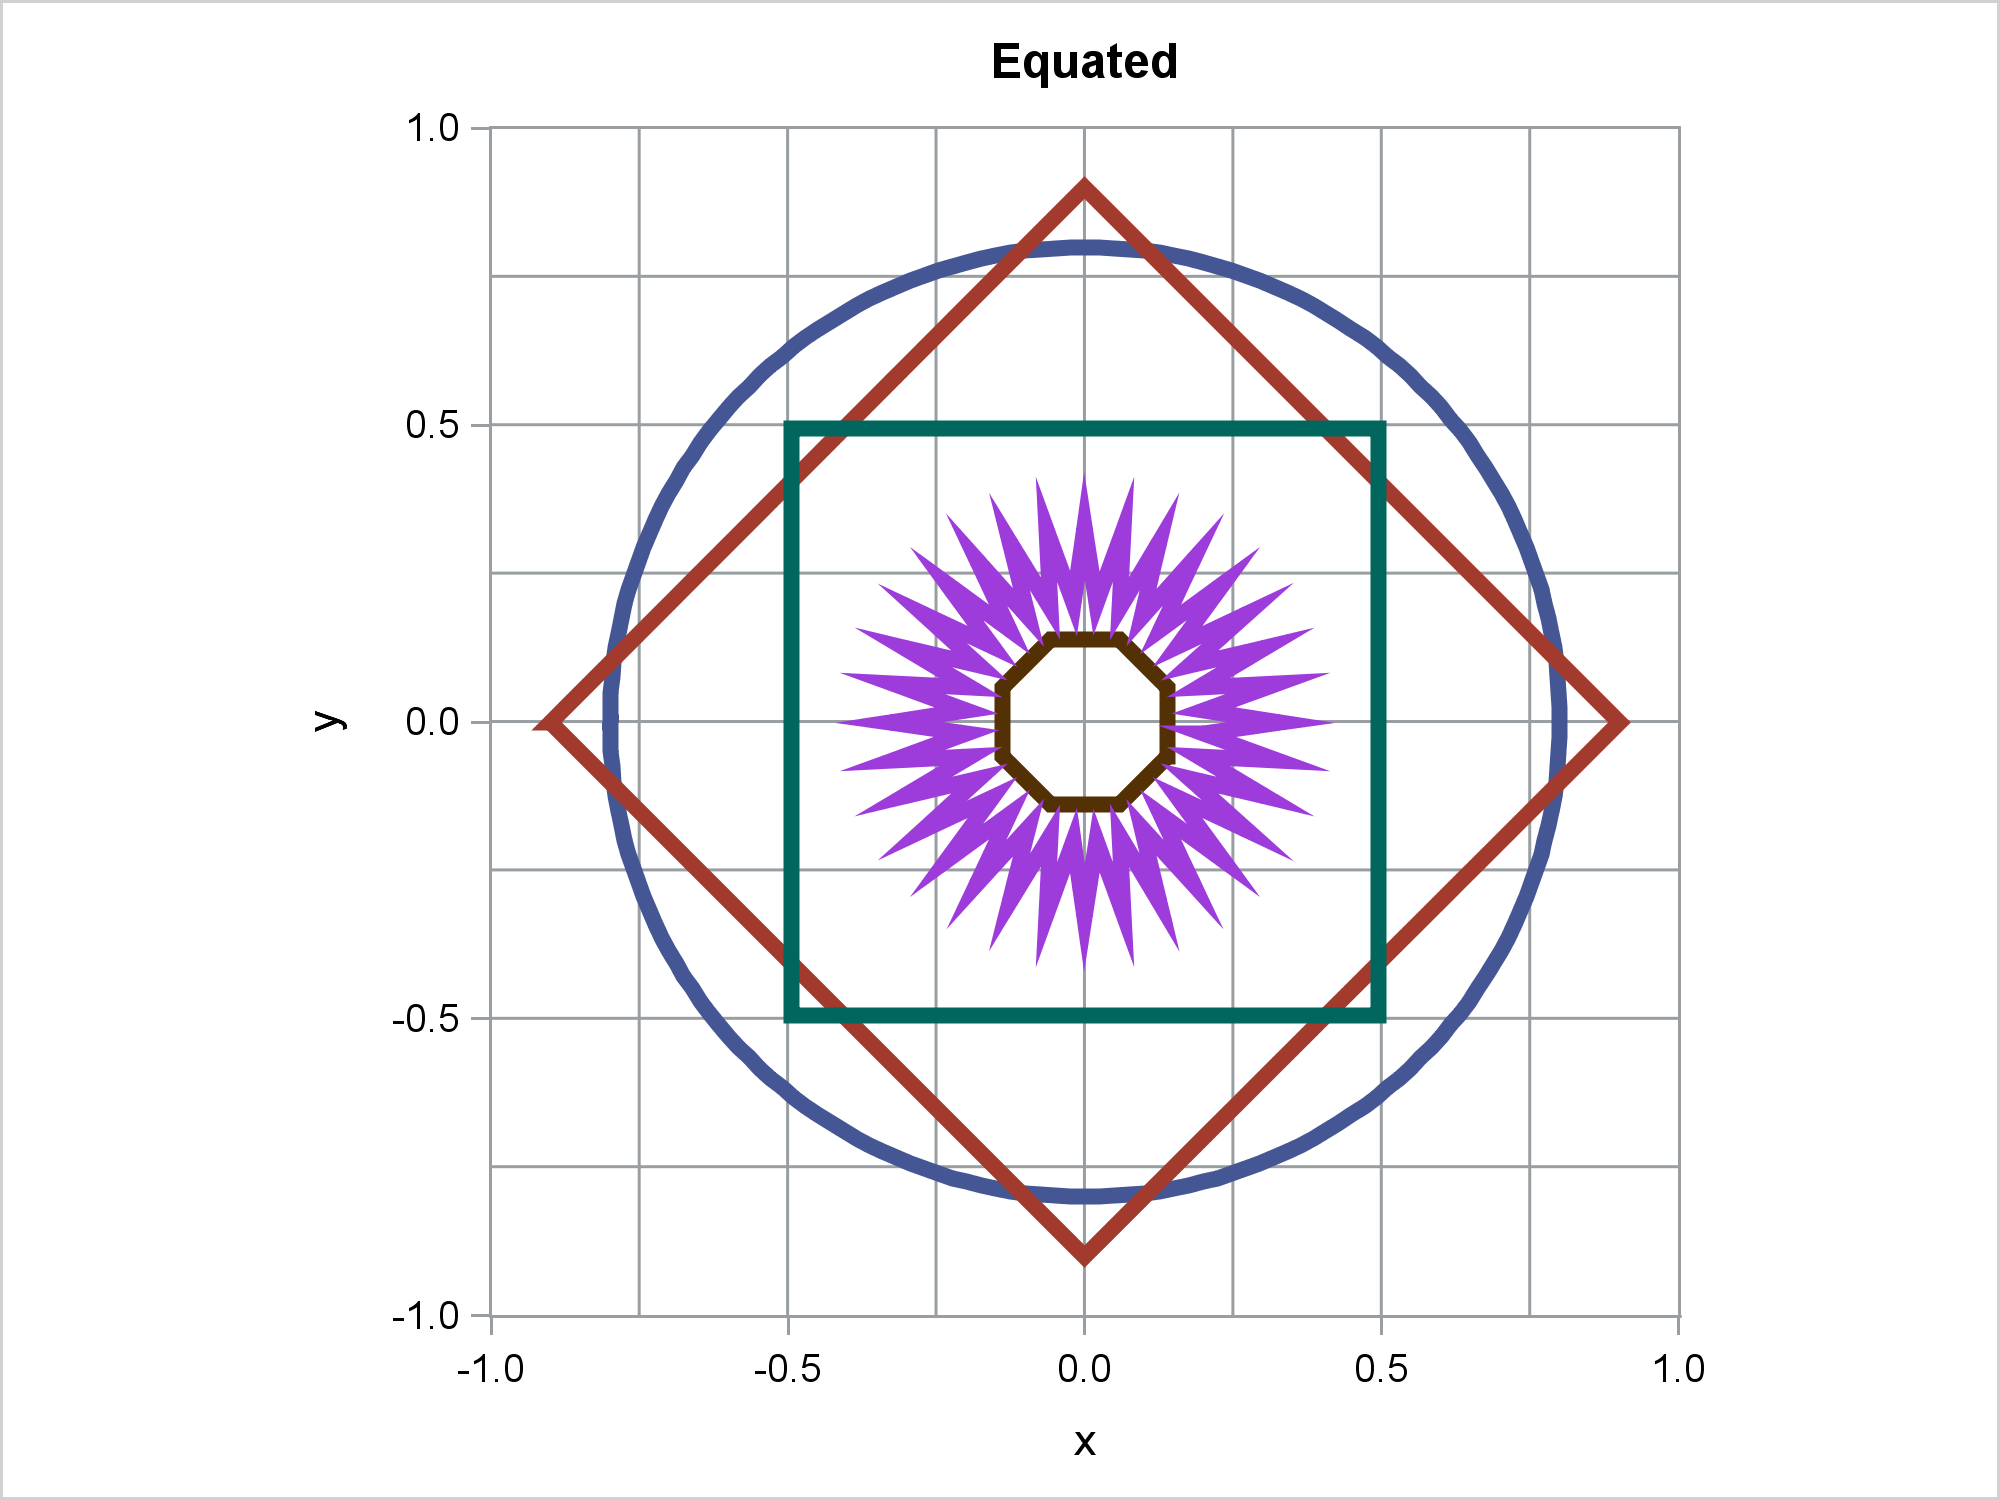

When displaying maps, geometric shapes (such as circles), or results of certain analyses, it is important to equate axes. This post illustrates options in PROC SGPLOT that enable you to equate axes.
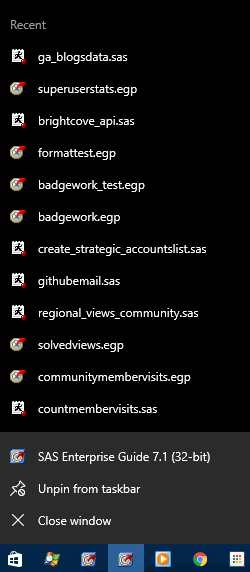

I use SAS Enterprise Guide every day, and for a wide variety of tasks. As a result, I have a huge collection of project files (EGP files) and SAS program files. I have always relied on the "recently used" list in the File menu to provide me with quick access
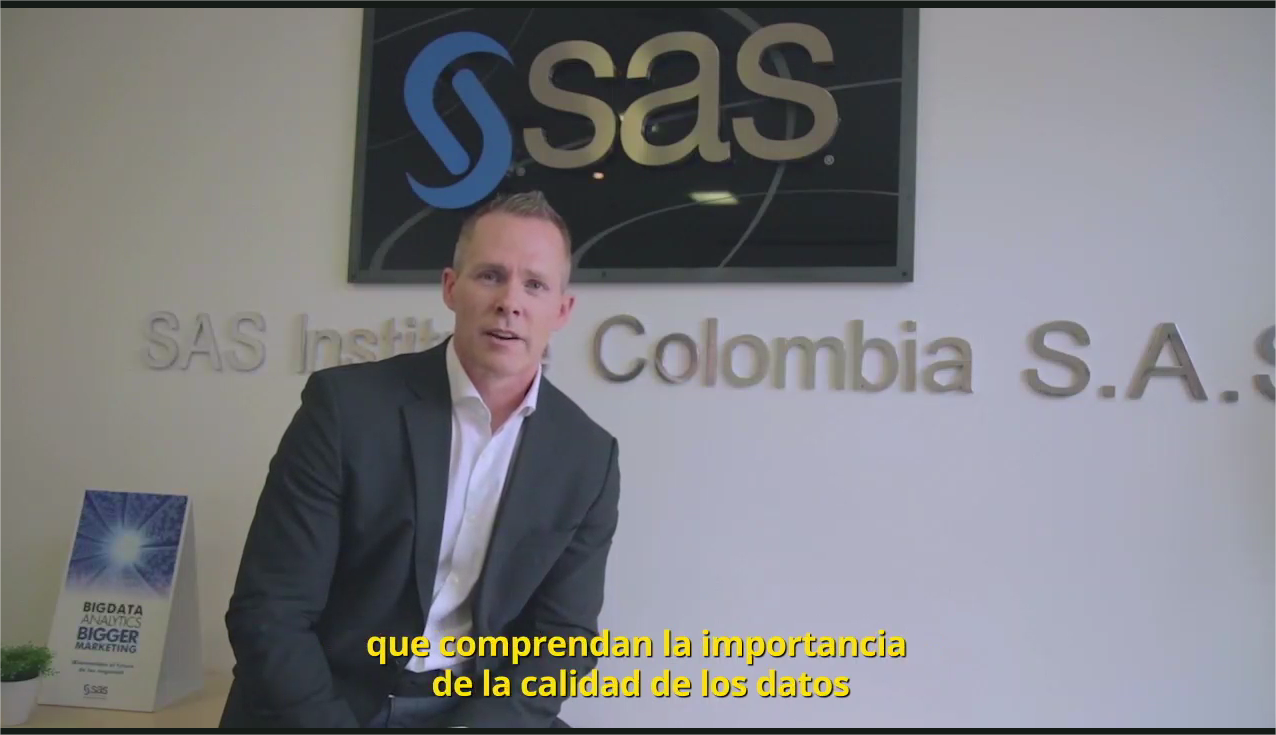

En el lenguaje de marketing, mucho hablamos de implementar estrategias digitales omnichannel y gestionar la experiencia de cliente de extremo a extremo. Si bien hay bastantes soluciones (mapas de viaje del cliente, diagramas de ciclo de vida) y tecnologías (motores de optimización, procesamiento de secuencias de eventos y automatización de marketing)
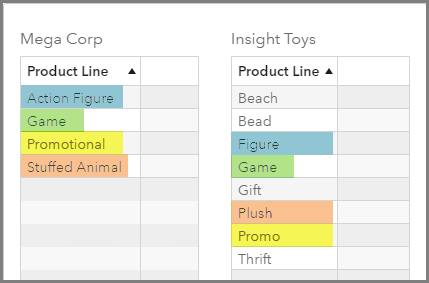

In a previous blog, I describe how there are a few new features related to report and page prompts in SAS Visual Analytics 8.1; namely the ability to configure cascading prompts in VA 8.1: Cascading Prompts as Report and Page Prompts. In this blog, I will cover how to configure prompts, either


“I do not like this modern technology,” said my father-in-law. “It is making people too lazy. Things are too easy now.” He was referring to my grocery order. I was sitting in his kitchen in Reykjavik, Iceland, the day before my return to the United States. I had just explained


Close your eyes and envision opening a bag of popcorn just out the microwave, watching the steam escape and inhaling the unforgettable aroma of delicious, buttery popcorn. Does your mouth immediately start to water? Does your mind wander to childhood memories? Now, where’s the popcorn?!


A classical problem in elementary probability asks for the expected lengths of line segments that result from randomly selecting k points along a segment of unit length. It is both fun and instructive to simulate such problems. This article uses simulation in the SAS/IML language to estimate solutions to the
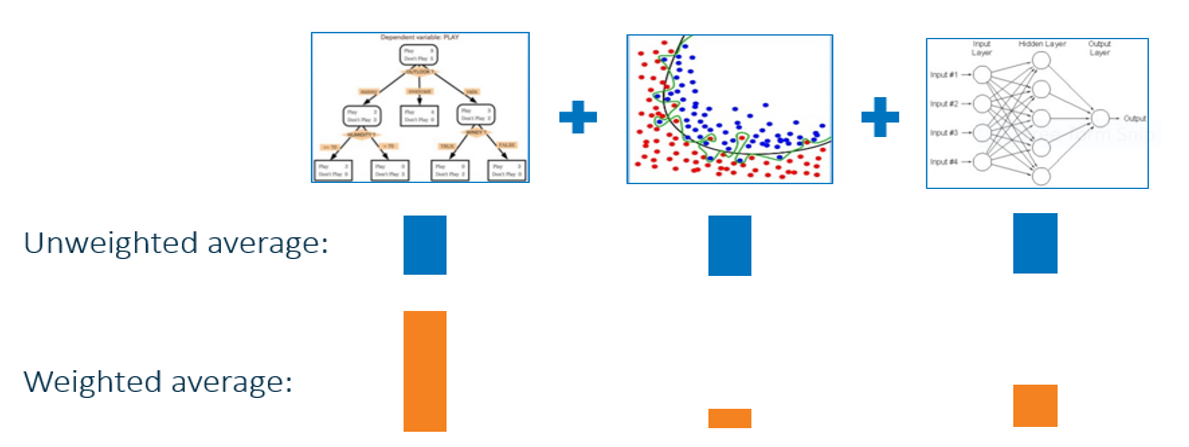

This is the third post in my series of machine learning techniques and best practices. If you missed the earlier posts, read the first one now, or review the whole machine learning best practices series. Data scientists commonly use machine learning algorithms, such as gradient boosting and decision forests, that automatically build

El aumento desmesurado de los datos y la latente necesidad de aprovecharlos para tomar mejores decisiones, ha llevado a que soluciones como las de la analítica no solo estén al servicio del crecimiento de los negocios, sino que tengan un alto impacto en la calidad de vida de las personas

Trivial Pursuit, Justin Bieber and Timbits. Some pretty great things have come from Canada, eh? Well, you can go ahead and add expert SAS programmers to that impressive list. In this video, six Canadian SAS programmers, with more than 115 years of SAS programming experience between them, share some of their favorite, little-known SAS programming tips. You're sure to discover a new trick or
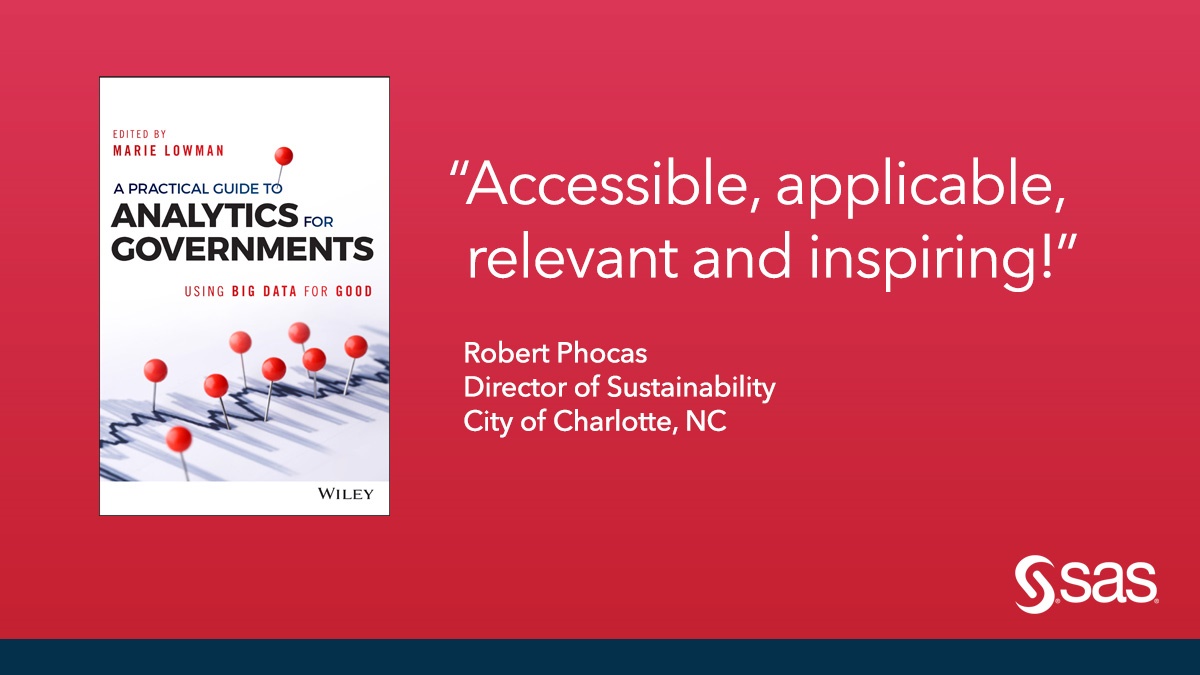

Too much to do and not enough time to do it. That's a common refrain in government, but an important one because of the critical role government plays in the lives of so many. In a new book from SAS, A Practical Guide to Analytics for Governments: Using Big Data