All Posts


Joyce Norris-Montanari poses the question: Is Hadoop/big data technology actually ready for MDM?
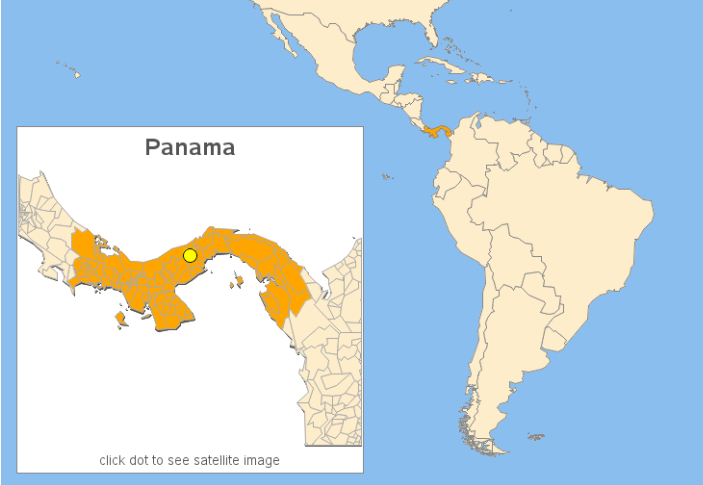

While attending SAS Global Forum, a user asked me about creating a map with a zoomed inset map. This is a topic many users might be interested in, so I decided to create an example and share it. But first, I had to decide which map to use. I thought
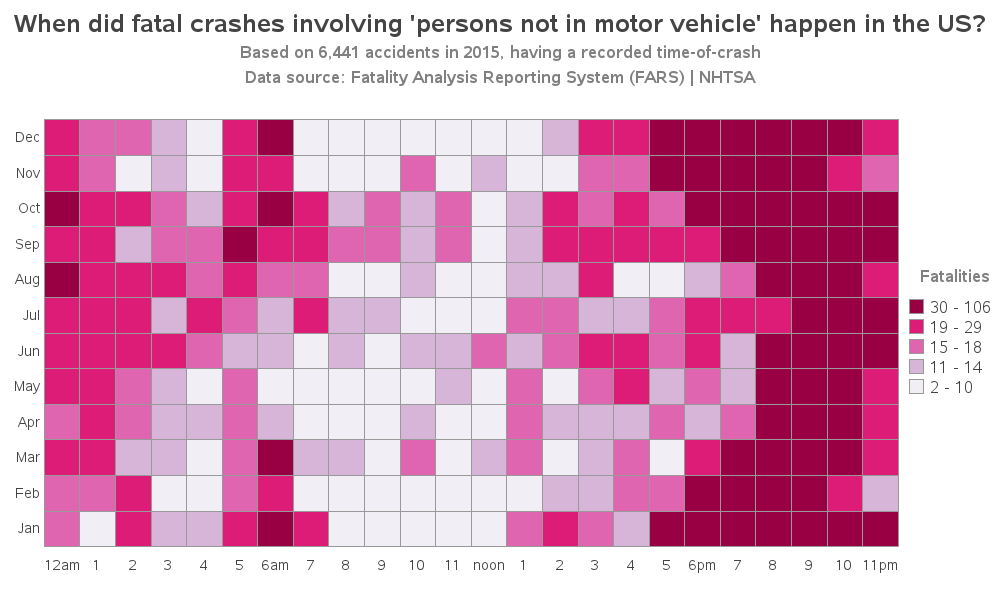
I recently saw an interesting data visualization on the flowingdata website, which analyzed & compared the causes of fatal crashes in the US, by month and time-of-day. At first I thought it was a really cool visualization, but after I studied it a while, I realized that I had misinterpreted
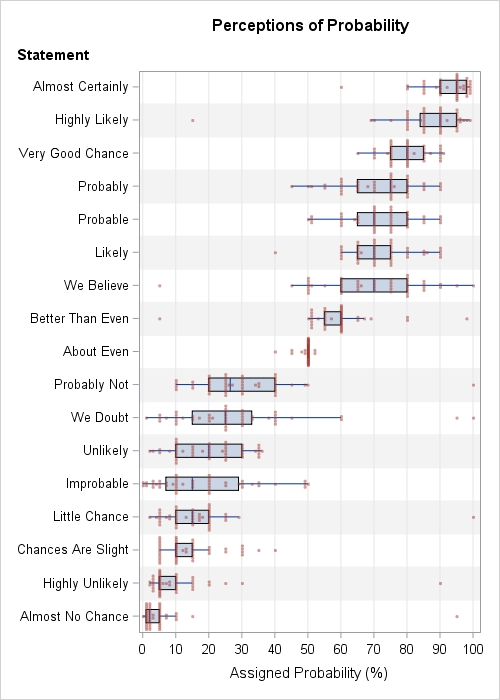

If a financial analyst says it is "likely" that a company will be profitable next year, what probability would you ascribe to that statement? If an intelligence report claims that there is "little chance" of a terrorist attack against an embassy, should the ambassador interpret this as a one-in-a-hundred chance,


今年のSAS Global Forum は、USのフロリダ州オーランドで開催されました。 例年同様日曜日スタート 従来と異なるのは、パートナー様向けの、SAS Partner Forum 2017 がSGFと同時開催されたことです。日本から参加されたSASジャパンのパートナー企業様は、前日夜のレセプションから始まり、イベント週間の先頭をきって、日曜日朝8:30からのSAS Executiveも登壇するセッションに参加いただき、みっちり午後までのスケジュールを、忙しくこなして頂きました。その様子は、こちらのSAS Partner Blogよりビデオでご覧いただけます。お忙しい中を時間を割いて日本からご参加いただくパートナー企業様が年々、増加しており、今年もセッション他、有意義なコミュニケーションの時間を過ごさせていただきました。誠にありがとうございます。多種多様なスキル・経験をお持ちのパートナー企業皆様に囲まれ、今後のSASビジネスに非常に心強さを感じました。 明日のリーダーを育成する さて、SAS Global Forum、通称SGFは、初日の夜のOpening Sessionからスタートなのですが、その前に、前述のパートナー様向けのイベントだけでなく、毎年最も重要なイベントの一つであるAcademic Summitが行われます。これは、SASが重要視することの一つである、人材育成・教育への投資、そしてその結果、社会へ優秀なデータサイエンティストを生み出すための活動であるAcademic Programの年次の総会のようなものです。教育関係者だけではなく企業関係者も参加することで、実務で役立つ教育の促進と人材の確保というエコシステムを形成しています。これを特徴付ける数字としては、このイベントのスポンサーを見てもわかります。 通常のパートナー企業様のスポンサーが29社 アカデミックのスポンサーは、16教育機関。 この数から見ても、本イベントを大学などの教育機関が重要視していて、教育と企業との連携が盛んであることが伺えると思います。 SAS Global Forumそのものが、教育機関と民間企業の接点の場であり、学生の発表や表彰、そして参加大学の企業へのアピールの場にもなっています。さて、Academic Summitのアジェンダを見てみましょう。 ネットワーキング SAS担当エグゼクティブの挨拶 スカラシップ受賞者の紹介 Student Ambassador Program受賞者の紹介 Student Symposiumファイナリストの発表 ゲスト講演 Student Symposium(SGF2017で実施されるコンペティション)の優勝チームである、Kennesaw State University の "The Three Amigos"は、「銀行の定期預金契約者の決定要因をロジスティック回帰と決定木で分析」したものでした。その他Student Symposiumの発表は以下のようなものがありました。 Dataninjas: Modeling Life Insurance Risk (Kennesaw State University)


La industria de Retail se encuentra en un proceso de transformación fundamental impulsado por las tecnologías digitales. Y a medida que los minoristas se adaptan a la era digital, la línea entre el comercio físico y el digital se está volviendo cada vez más borrosa. Desde la perspectiva de los

When I first wrote this blog post in early May 2017, it was to ask SAS users holding SAS “Big Data” certifications to participate in the CertMag Salary Survey Plus Big Data Edition. The response was overwhelming and thanks to all of you that participated. Now that the results are in, I wanted


.@philsimon chimes in on some oft-overlooked differences.


For many years the humble spreadsheet has held many different roles and responsibilities supporting finance, marketing, sales -- pretty much every department in your business. There's always someone with a “magic spreadsheet,” but how effective is this culture that always uses the same format to consume data? My view of

Each year at SAS, along with companies around the world, we celebrate health and fitness at work and this year is no exception! The Recreation and Fitness Center, Health Care Center, Work/Life Team, the Cafes, our Environmental Sustainability Team, and Research and Development Departments have teamed up to promote whole body
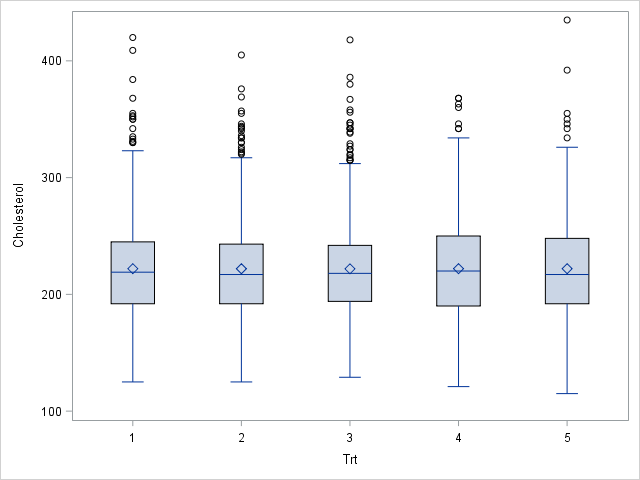
A frequently asked question on SAS discussion forums concerns randomly assigning units (often patients in a study) to various experimental groups so that each group has approximately the same number of units. This basic problem is easily solved in SAS by using PROC SURVEYSELECT or a DATA step program. A


Machine learning seems to be the new hot topic these days. Everybody's talking about how machines are beating human players in chess, Jeopardy, and now even Go. In the future, artificial intelligence will drive our cars and our jobs will be taken over by robots. There’s a lot of hype,
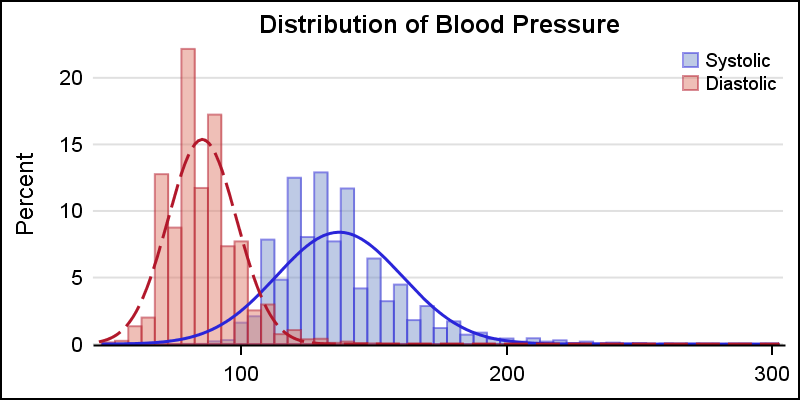

This is the 5th installment of the Getting Started series. The audience is the user who is new to the SG Procedures. Experienced users may also find some useful nuggets of information here. A histogram reveals features of the distribution of the analysis variable, such as its skewness and the peak which

The SAS Data Scientist Credential SAS Data Science Academy brings in a complete set of certifications which enables somebody to be qualified as “Data Scientist”. There is full training support , blended mode of learning , case studies, projects and practice exams by the academy. By successfully passing certification exams,


Todos hemos oído alguna vez que “cualquier tiempo pasado fue mejor” pero, cuando se trata de negocios, el pasado ha dejado de ser una ventaja. Hoy en día, medir el presente y el pasado ya no marca una diferencia competitiva. Ahora las empresas encuentran mayor valor en analítica predictiva (enfocada