All Posts
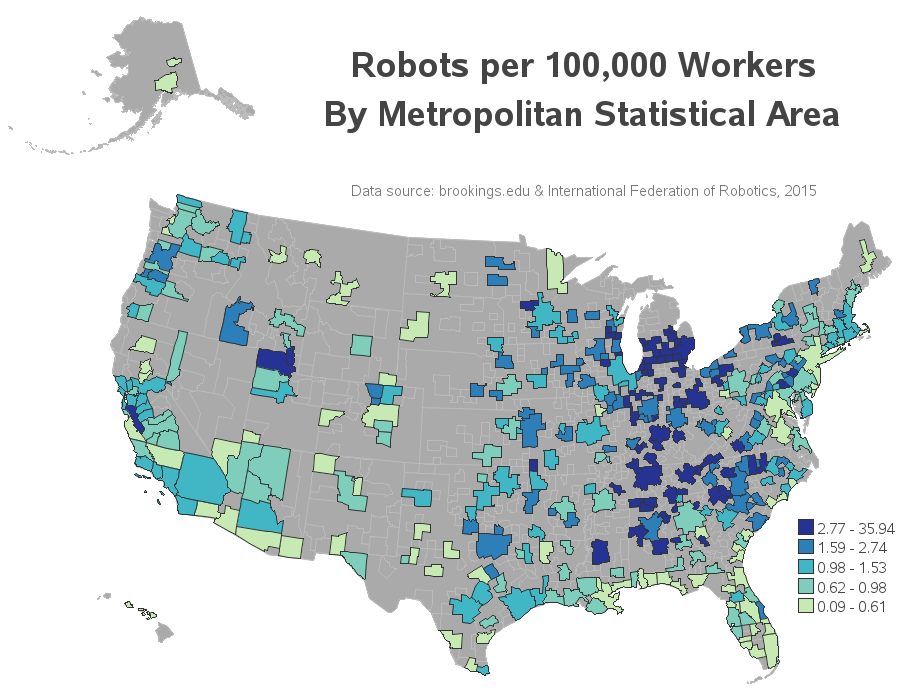

Robots - everyone has probably been fascinated by the idea of robots at one time or another. From the early science fiction robots (such as Klaatu's robot Gort) to the mid-1980s movie robots (like Johnny 5), they have been portrayed in many different ways in fiction. These days, with the
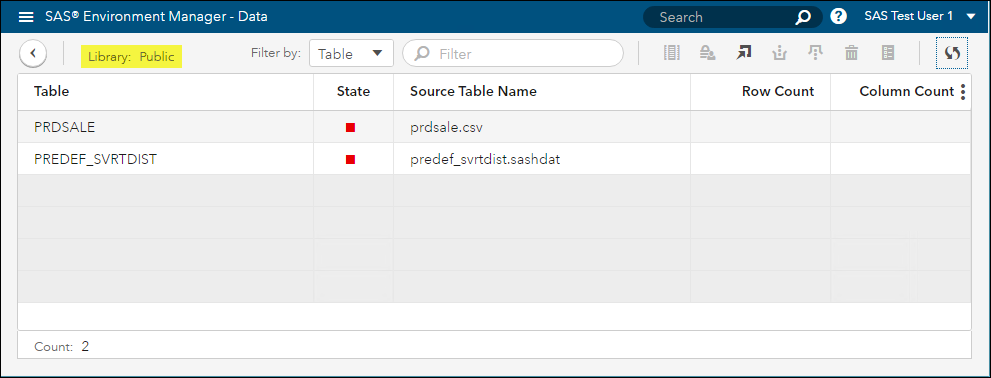

In this blog post I am going to cover the example of importing data into SAS Viya using Cloud Analytic Services (CAS) actions via REST API. For example, you may want to import data into a CASLib via REST API. This means you can perform an import of data outside


Analytics-driven forecasting means more than measuring trend and seasonality. It includes all categories of methods (e.g. exponential smoothing, dynamic regression, ARIMA, ARIMA(X), unobserved component models, and more), including artificial intelligence, but not necessarily deep learning algorithms. That said, deep learning algorithms like neural networks can also be used for demand forecasting,


This question has been asked repeatedly for decades by anyone facing a new system. That system might be a new product, a new piece of equipment, a new process, or anything really that is new and not well understood. Ultimately, you might need to change this system but first you


How to “Mind your Mind” and Improve your Well-being This morning you woke up, started your day and, whether you realized it or not, you said some things to yourself. You may have said, Today is going to be great… I am going to succeed… I look good! or perhaps


I frequently get asked about my favorite book on a particular topic, how to find free SAS learning materials online, how to get help with SAS issues, etc. So I thought I'd share it with you here! Last updated 2/25/2020 Getting Started Resources New to SAS? Here's your SAS Starter
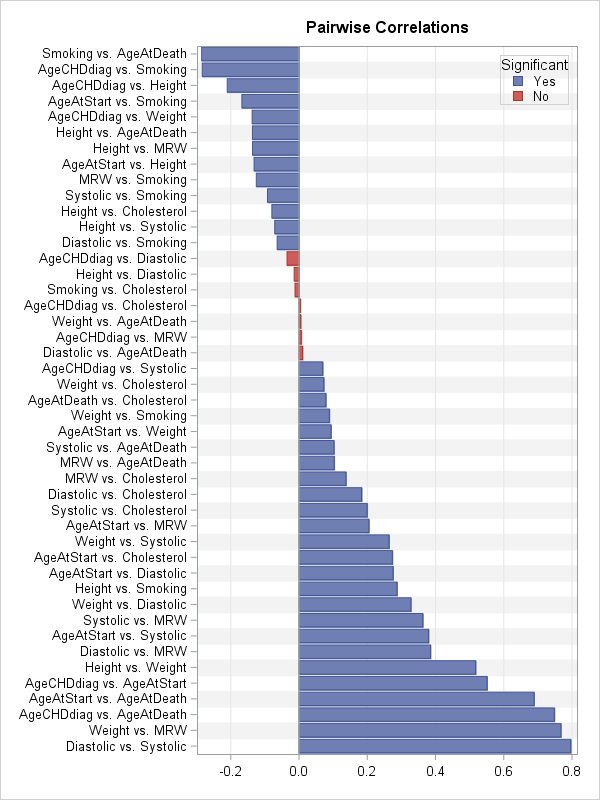

Visualizing the correlations between variables often provides insight into the relationships between variables. I've previously written about how to use a heat map to visualize a correlation matrix in SAS/IML, and Chris Hemedinger showed how to use Base SAS to visualize correlations between variables. Recently a SAS programmer asked how
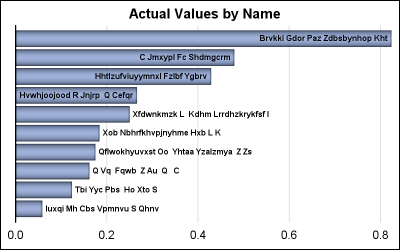

A few days ago, I posted an article on displaying first N bars from a data set. This is useful when the data is sorted by descending response, and only the first few values are significant. There were a few interesting comments, including one that was regarding the treatment of
If you know me, you probably know that I spend a lot of time on the water. I like speed paddling (dragon boat, outrigger canoe, surfski, and racing SUP), and I also have a big pontoon boat at Jordan Lake where I try to go fishing at least once a


En los últimos años la analítica se ha convertido en el driver para cambiar al mundo y una muestra de ello son Colpatria en Colombia, Club Premier en México y VTR en Chile que muestran resultados importantes en transformación digital gracias al mejor aprovechamiento de sus datos. En frentes como el


Veterans transitioning back to civilian life face a number of challenges, many of which involve working in a non-military environment. The Honor Foundation helps Navy SEALs and other current and transitioning members of the U.S. Special Operations community enter civilian life. Last week, a group of former special operators visited several

The Cloud Analytic Server (CAS for short) is SAS’ latest high-performance, scalable, in-memory analytic data server. In this post, I’d like to discuss the CAS physical data model, i.e.what features CAS offers for data storage, and how to use them to maximize performance in CAS (and consequently SAS Visual Analytics


PROC SGPLOT displays titles inside the graph. If you want to display a title inside the graph and a different title outside the graph, you can use the ODS LAYOUT or the GTL. The ODS LAYOUT gives you precise control over your output and enables you to display multiple graphs and tables in each page.

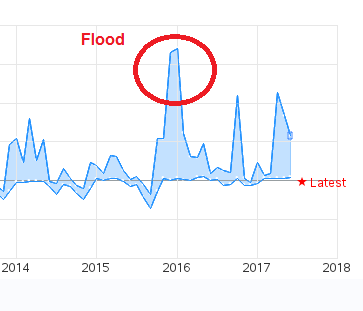
In an increasingly complicated operating environment, the global oil and gas industry struggles to optimize their asset portfolio. Producers combat severe challenges inherent to aging facilities in the context of pricing volatility. Change is the new constant, as the cyclical nature of the oil and gas industry means that producers


Phil Simon shares his thoughts on this simple yet often-overlooked question.