All Posts


Opens the chest, neck and spine while engaging the glutes, quadriceps and hips. Bridge (Sanskrit: Setu Bandha Sarvangasana) Lie on your back. Bend your knees and have feet on floor/mat. Knees and feet are hip distance and arms along the sides of the body with palms down. Back heels up


When disasters strike, we’re all left wondering what we can do and how we can help. Many donate money and items. Others donate their time volunteering on the ground. Me? I dive into data. I have a passion for using data for good, and have been fortunate to be involved
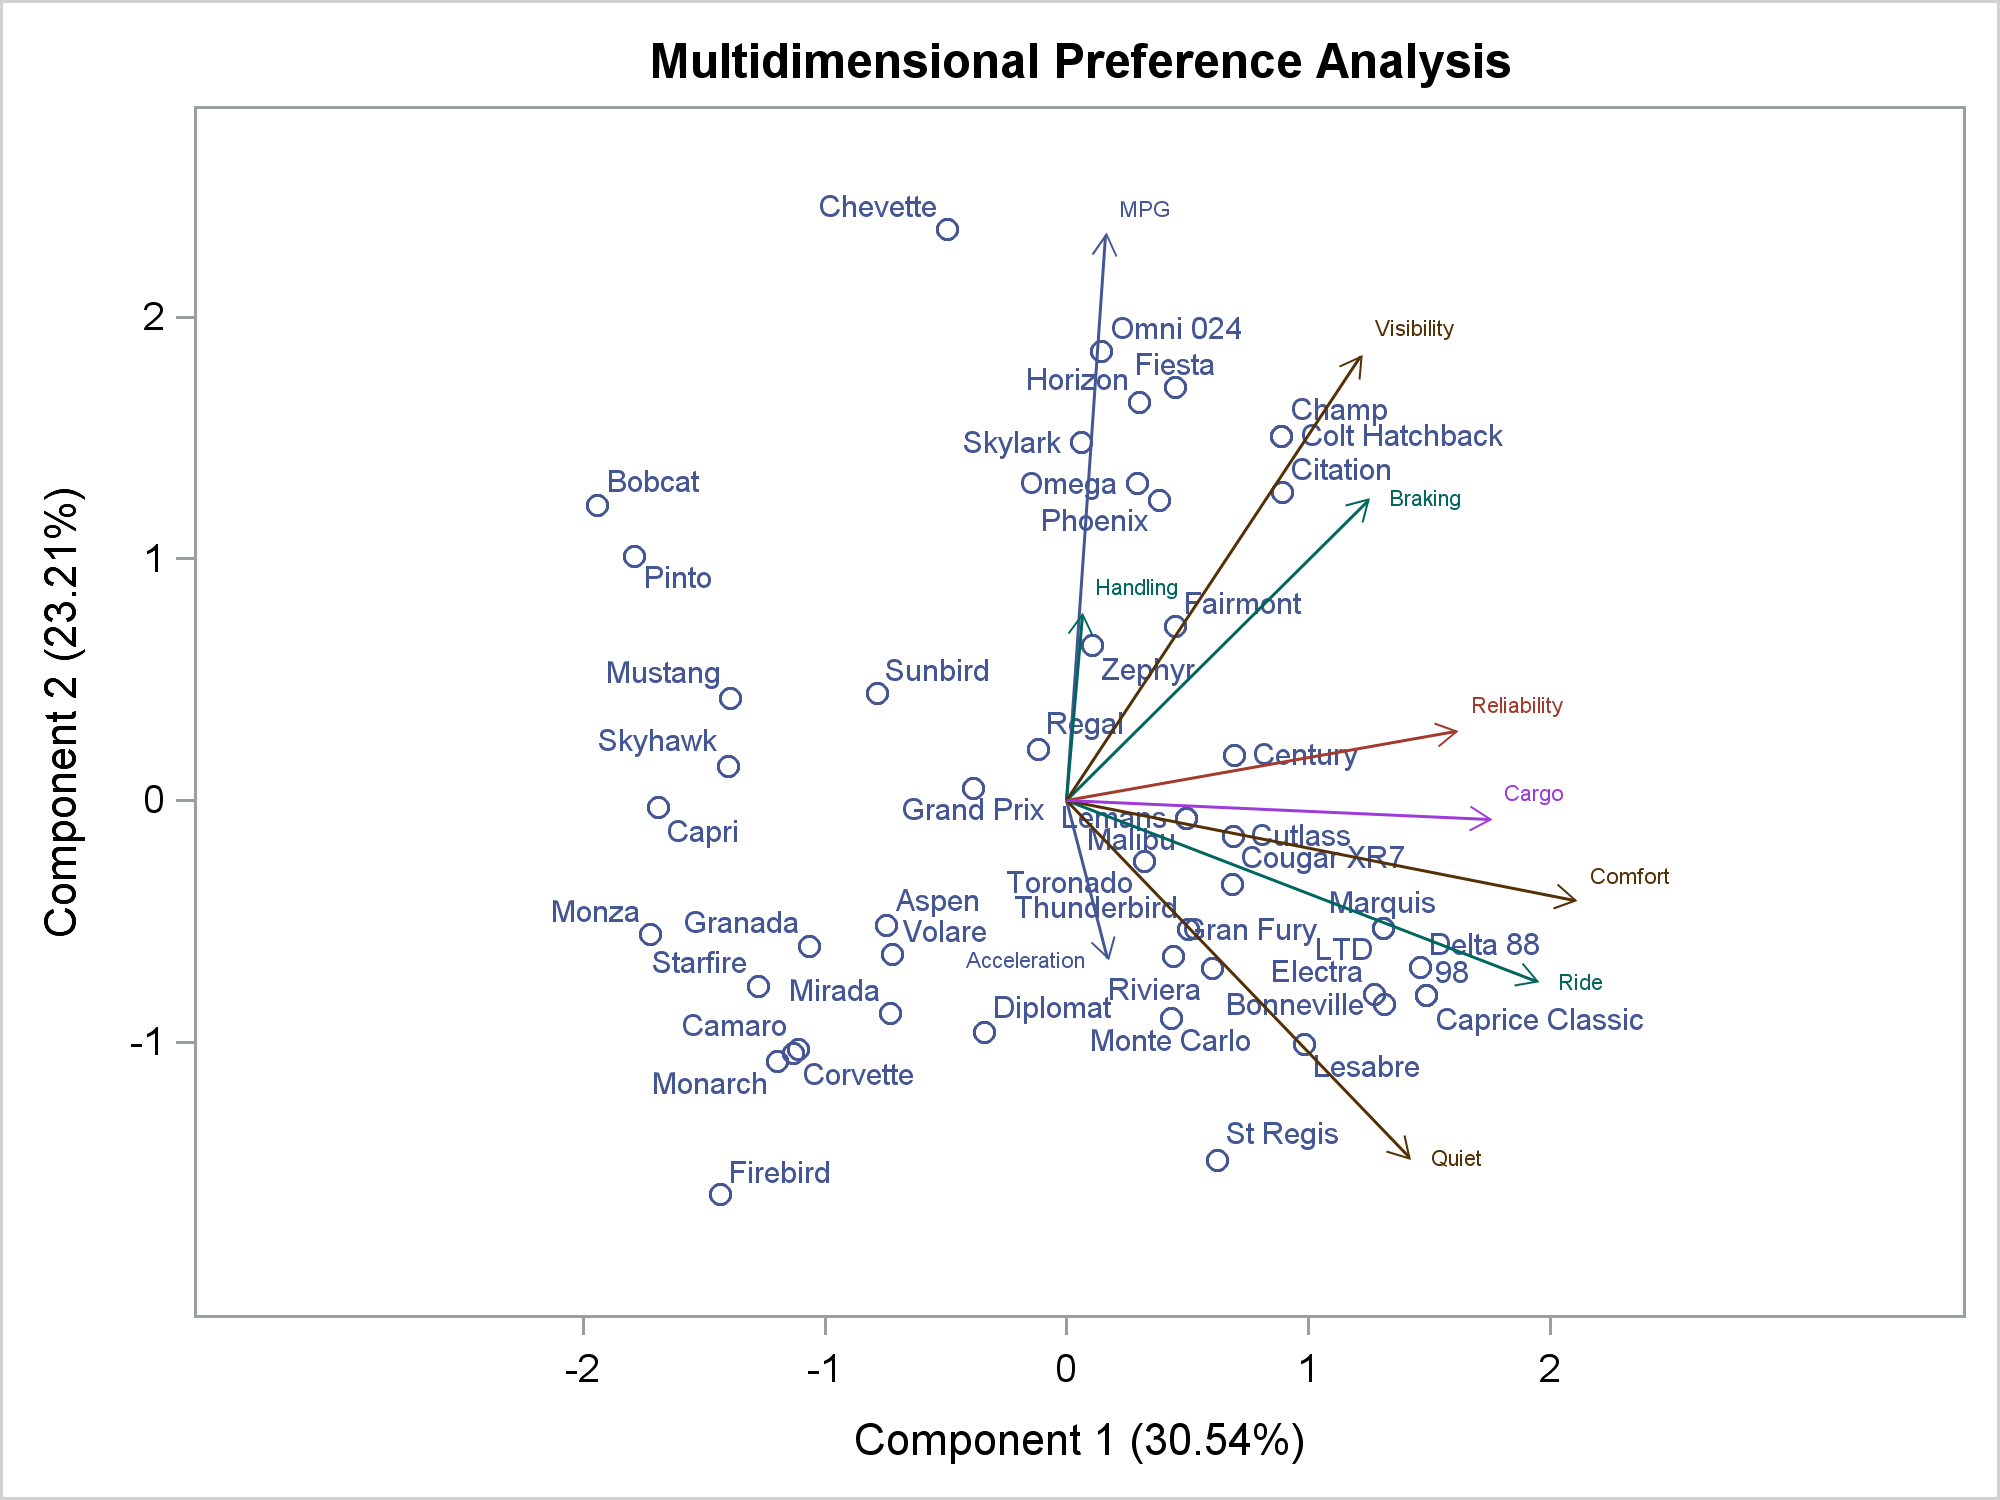

You can modify all of the components of the graphs that analytical procedures produce: the data object, graph template, and the dynamic variables. This post takes a closer look at dynamic variables (which you can see by using PROC DOCUMENT) and data objects and explores graphs that are constructed from more than one data object.

In my first four posts in the education analytics blog series, we learned how education customers are using SAS, the positive impact for their users and institution, and some of their best practices. In talking to customers for this series, one of the many things we've learned is that they


Once you have a data strategy for omnichannel, what's next? Kim Kaluba explains.
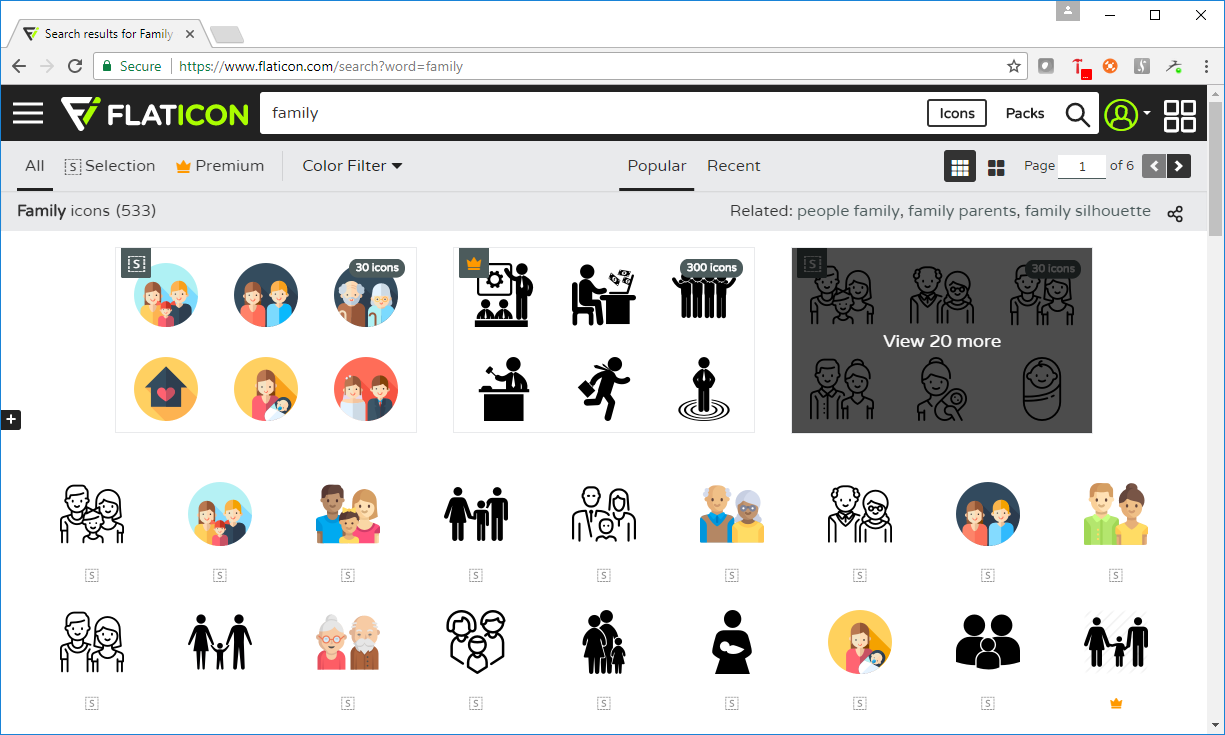

SAS Visual Investigator has an attractive user interface. One of its most engaging features is the network diagram, which represents related ‘entities’ and the connections between them, allowing an investigator to see and explore relationships in their source data. For maximum impact, each entity in the network diagram should have an
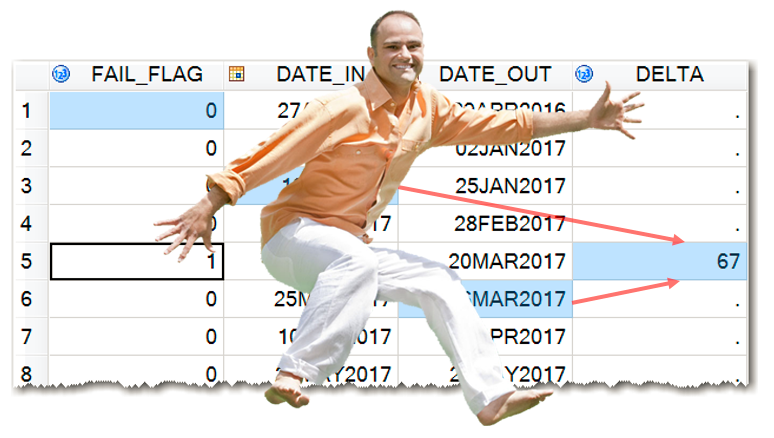

The purpose of this blog post is to demonstrate a SAS coding technique that allows for calculations with multiple variables and multiple observations across a SAS dataset. This technique can be useful for working with time series, clinical trials, - in any data step calculations involving values from different observations.
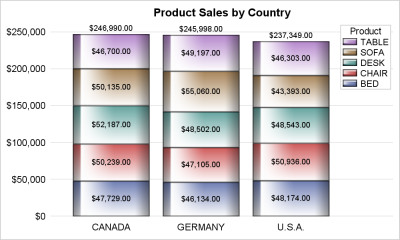

Once in a while you run into a pesky situation that is hard to overcome without resorting to major surgery. Such a situation occurs when you have a stacked bar chart with a discrete legend positioned vertically on the side of the graph. A simple example is shown below. title


Need to grant one or more users access to part of your secure SAS configuration directory? You can do it without opening up your SAS configuration directory to everyone. Most SAS 9.4 Platform deployments on Unix have been done using the SAS Installer account known as sas. The sas account
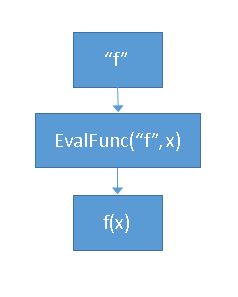

A SAS/IML programmer asked whether you can pass the name of a function as an argument to a SAS/IML module and have the module call the function that is passed in. The answer is "yes." The basic idea is to create a string that represents the function call and then


A ghoulish Halloween Boo to all my readers! Hope my costume freaks you out, but even if it doesn't, I’m positive PROC FREQ will in a few amazing ways! Today’s Programming 2: Data Manipulation Techniques class asked about the power of PROC FREQ. Since I stopped to explain some of it's benefits to


I often create temporary ODS output files - and getting rid of those files after I'm done is an extra chore I don't relish. For example, if I want to generate a PDF-only report and email it from SAS (see "Jedi SAS Tricks: Email from the Front – Part 2")


Joyce Norris-Montanari says IT and business need to work together when giving business users self-service data preparation tools.
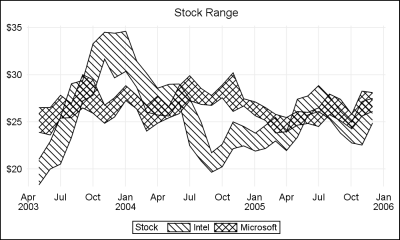
When a plot is classified by one or more variables, the different classes values are displayed in the graph either by position or by using different plot attributes such as color, marker shape or line pattern. For plots that display the visual by a filled area (bar, bin, band, bubble,
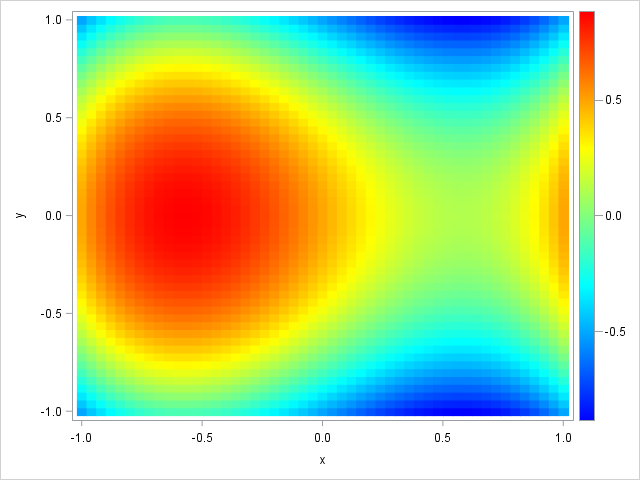
This article demonstrates a SAS programming technique that I call Kuhfeld's template modification technique. The technique enables you to dynamically modify an ODS template and immediately call the modified template to produce a new graph or table. By following the five steps in this article, you can implement the technique