All Posts

They say time flies when you’re having fun, and my time as a SAS Intern (a whole 11 months!) has been no exception. My SAS experience has been full of meaningful work, relationship building, skill development and, let’s face it, a copious amount of M&M’s. I feel extremely lucky to
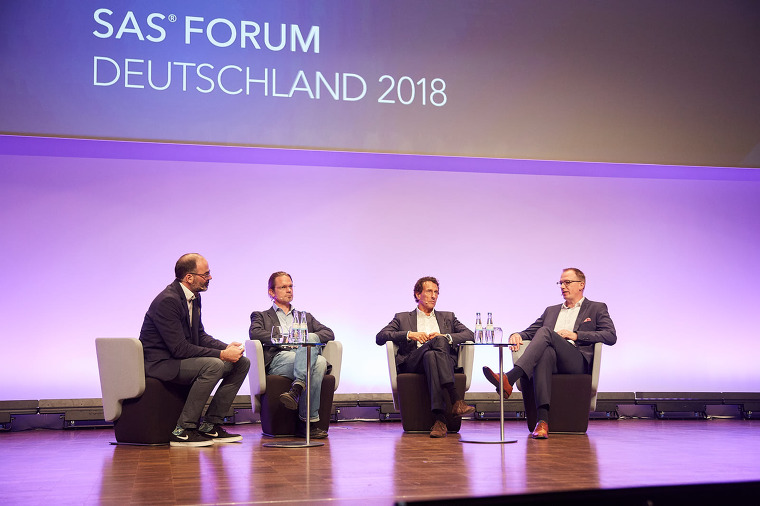

최근 독일에서 개최된 SAS 포럼에서는 데이터 과학 및 분석과 관련된 다양한 핸즈온(hands-on) 세션과 워크숍이 진행됐습니다. 이전 포럼에서는 볼 수 없었던 몇 가지 분석 동향의 큰 변화가 있었는데요. 주요 시사점을 소개합니다. 분석의 대중화 올해 워크숍의 티켓은 일찍부터 매진이었습니다. 그 자체만으로도 기분 좋은 소식이지만, 사실 더 중요한 사실을 암시하는데요. 이는 참석자 모두가
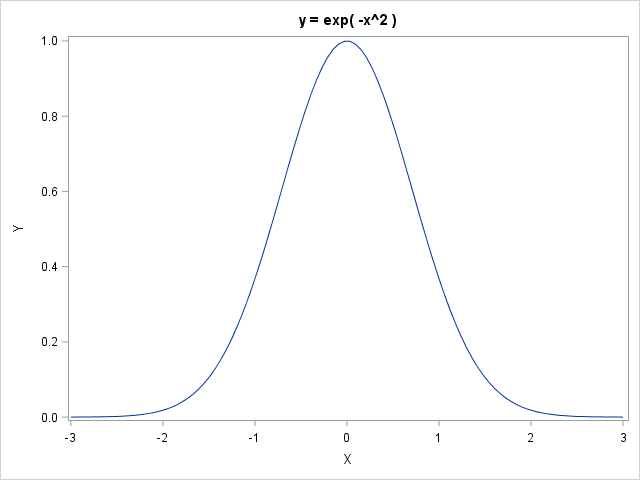

The SAS/IML language and the MATLAB language are similar. Both provide a natural syntax for performing high-level computations on vectors and matrices, including basic linear algebra subroutines. Sometimes a SAS programmer will convert an algorithm from MATLAB into SAS/IML. Because the languages are not identical, I am sometimes asked, "what

What’s that buzz on the power line? It’s AI, of course! But what is AIoT, you ask? It is applying artificial intelligence (AI) to data from smart devices connected by the Internet of Things (IoT). AI is the science of training systems to perform human tasks through learning and automation.


Desde que era un niño, fui un apasionado por las series policíacas. Pero más allá de ver como se enfrentaba a la delincuencia e injusticia, me gustaba observar cómo se desarrollaba el marco investigativo hasta dar con los autores de hechos criminales, la metodología empleada y los diferentes medios y


El internet de las cosas, las plataformas multimedia, la movilidad, la realidad virtual y aumentada, han adquirido mayor importancia en los últimos años, transformándose en vitrinas para vender y dar a conocer nuevos bienes y servicios. La realidad virtual y la realidad aumentada, son conceptos tecnológicos que, hasta hace poco,


La Inteligencia Artificial (IA) salió de los libros y las películas de ciencia ficción. Actualmente es parte de la vida cotidiana de millones de personas alrededor del mundo: está presente en sus dispositivos móviles, en sus navegadores, en las plataformas que utilizan para reproducir música y video, cuando compran en
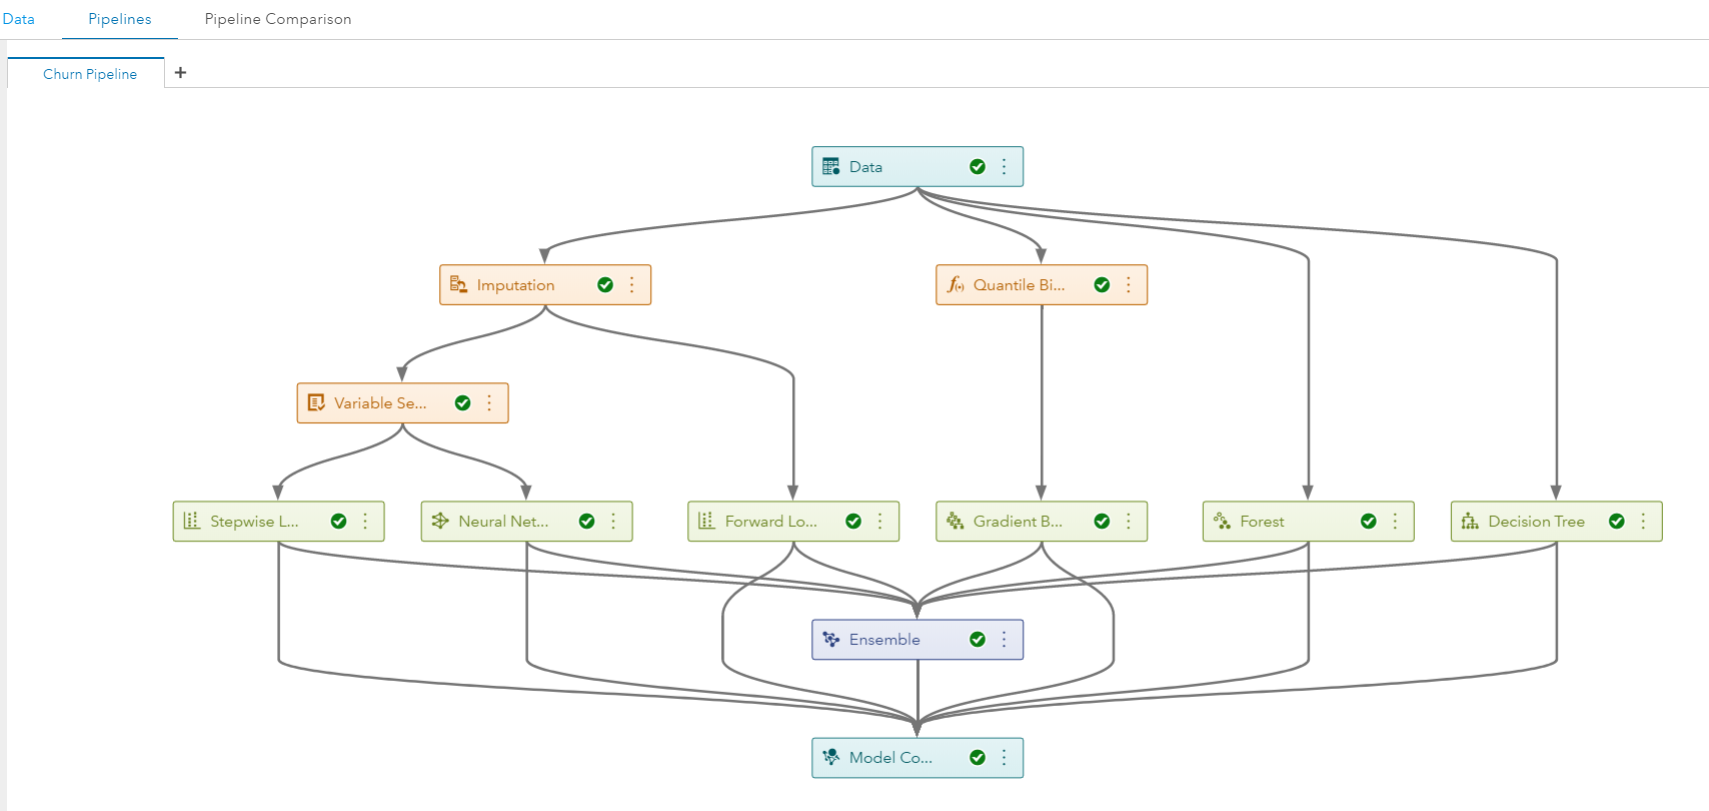

This post goes through the steps to build complex models in SAS Model Studio and publish and run them to Hadoop in SAS Viya.


Nothing says you are wasting your time and energy more than referring to a process as plowing a field with a fork. I liked to use this phrase as a manager and auditor, especially in government. Good data analytics makes a big difference in problem solving. Does anyone think a
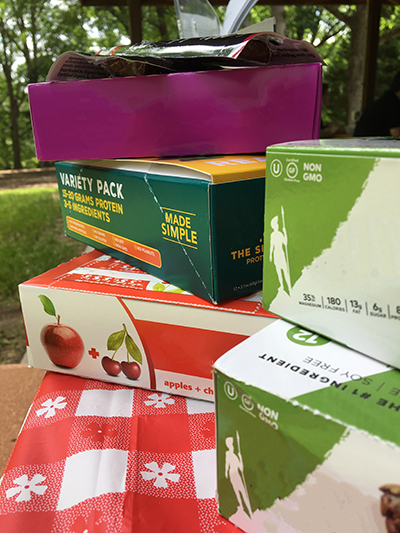

Trying to clean up your snacks but struggling to decipher which store-bought options are truly clean and nutritious? We scoured the stores and web and came up with this list of travel-friendly, no refrigeration required snack discoveries (tasted tested and approved!) as well as a few recommendations to help you
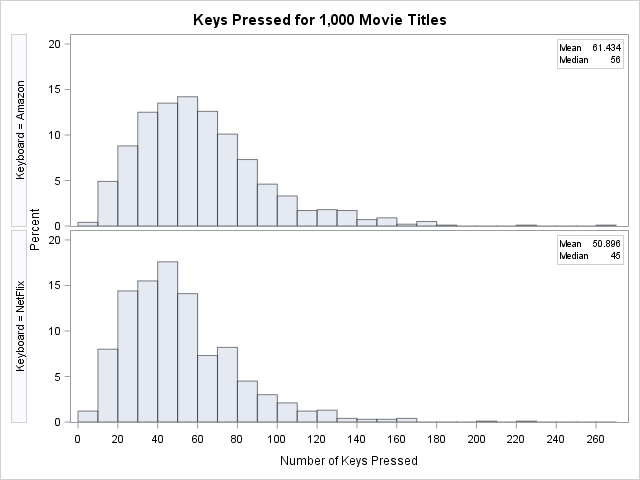
Have you ever tried to type a movie title by using a TV remote control? Both Netflix and Amazon Video provide an interface (a virtual keyboard) that enables you to use the four arrow keys of a standard remote control to type letters. The letters are arranged in a regular
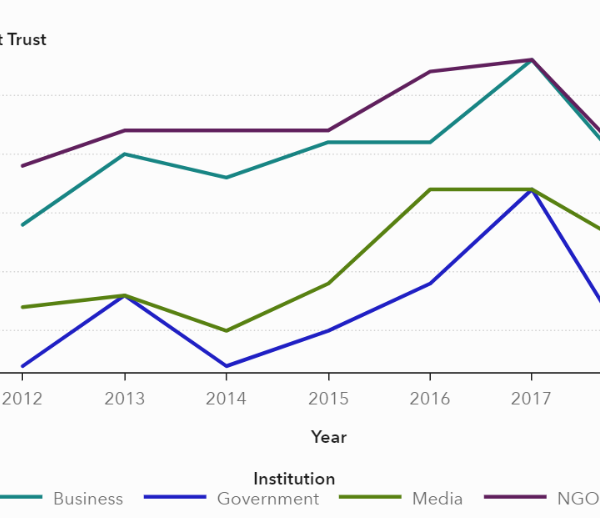

The data I was analyzing was about “trust.” Maybe that’s what got me thinking about Stephen Sondheim, the Broadway composer and lyricist of musicals like Sunday in the Park with George and Into the Woods and the lyricist for West Side Story. Trust is a heavy emotional topic. Developmental psychologists

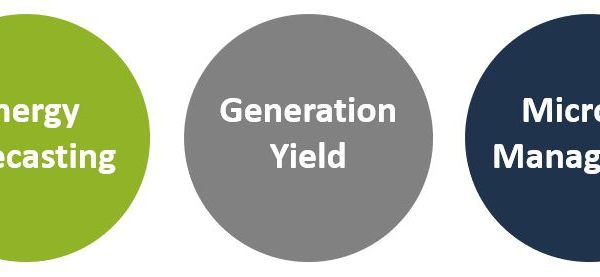
지난 7월 정부는 스마트 그리드(smart grid) 서비스가 구현되는 체험 단지 조성 등을 골자로 하는 ‘제 2차 지능형 전력망 기본 계획’을 발표했습니다. 이에 따라 올해부터 2022년까지 스마트 그리드 서비스 활성화, 각종 인프라 구축 등에 4조5,000억 원을 투자할 방침입니다. 스마트 그리드는 전기의 생산, 운반, 소비 과정에 정보통신기술(ICT)을 접목해 효율성을 높일 수 있도록

You can use Unicode to display special characters in SAS output including tables and graphs. With graphs that analytical procedures produce, you might need additional steps.
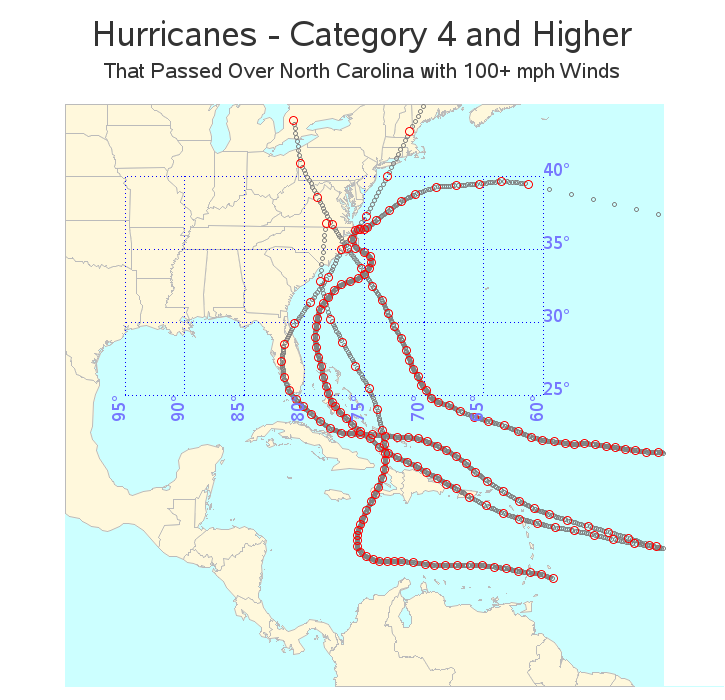

Here in North Carolina (NC), we're pretty much resigned to the fact that many of the hurricanes in the Atlantic Ocean are going to visit us. NC sticks out farther into the ocean than most of our neighboring states, and that just makes a tempting target for the hurricanes. But