All Posts
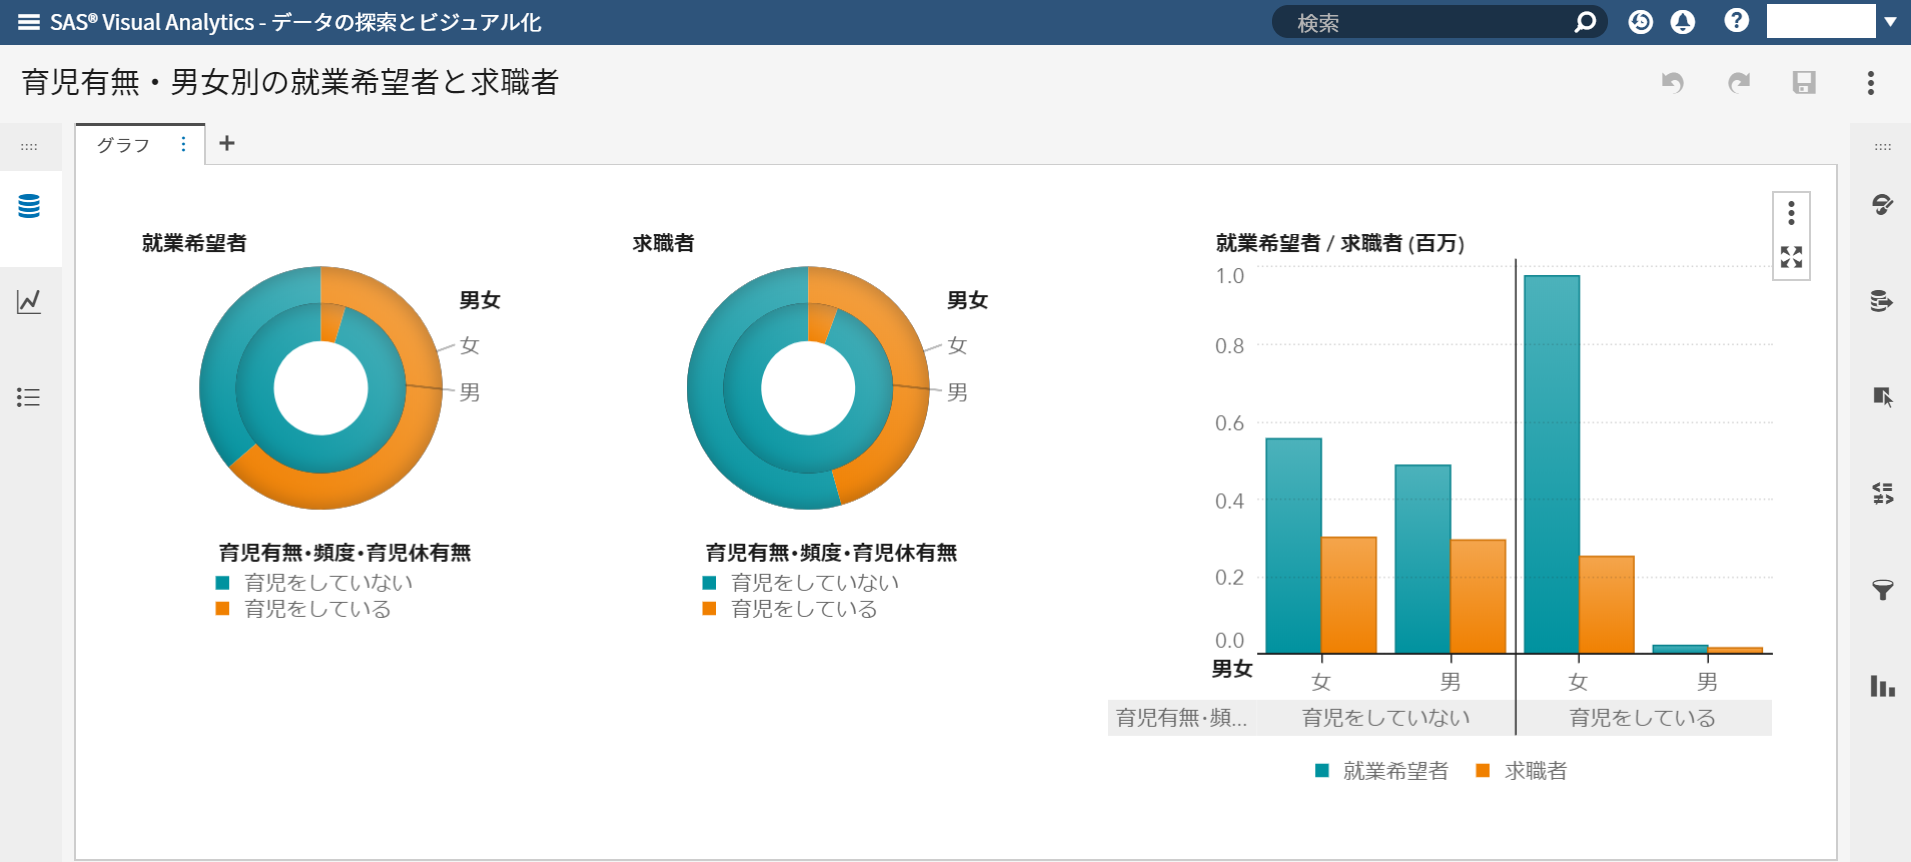
前回のブログでは、統計解析の一例として、線形回帰分析の方法をご紹介しました。今回はデータを用いてクロス集計表(分割表)を作成し、円グラフ・棒グラフに可視化する方法をご紹介いたします。 第1回和歌山県データ利活用コンペティションでテーマに挙げられていた「人口減少問題を解決するための施策」をテーマに分析をします。人口減少の原因に女性の社会進出に対する意識が影響しているのではないかと考えました。もし、まだ子育てをしていない女性が育児と仕事を両立したくてもそれが難しいと感じるようでしたら、このことは人口減少の障害になりかねません。そこで、就業希望者と求職者について男女・育児活動の有無を項目にし、関連性を探りました。 以前、データのインポート方法を紹介したブログで利用した総務省統計局の平成29年 就業構造基本調査 都道府県編 「男女,育児の有無・頻度・育児休業等制度利用の有無,年齢,就業希望の有無・求職活動の有無別人口(無業者)-全国,全国市部,都道府県,都道府県市部,政令指定都市」のデータを利用します。 データのインポート方法に関する記事は過去のブログ記事をご参照ください。 SAS Visual Analytics 8.3 におけるクロス集計表の作成と可視化 from SAS Institute Japan 作成したグラフから、女性の中でも育児活動の有無により求職者数にはあまり差がない一方で、就業希望者数は育児活動をしている女性の方が多いことがわかります。このことから、子育てをしている女性は仕事をしたいとは思っても実際には求職活動を行っていないということがわかります。 今回のように男女・育児活動の有無など質的変数同士の関係を考察する場合、データをクロス集計表にまとめると分析がしやすくなります。また、インポートしたデータの中から必要なものを取り出すためにフィルタを活用することが効果的です。グラフを作成する際は、軸にどのようなカテゴリを選択するか、メジャーには何を用いるかなどについて自分の分析したい目的に合わせて考えてみてください。 引き続き本ブログのシリーズ Visual Analyticsを用いた図・グラフの作成や統計解析について紹介いたします。 第2回和歌山県データ利活用コンペティションへの参加も募集中ですので、高校生・大学生のご参加をお待ちしております。(追記:募集は締め切られました)
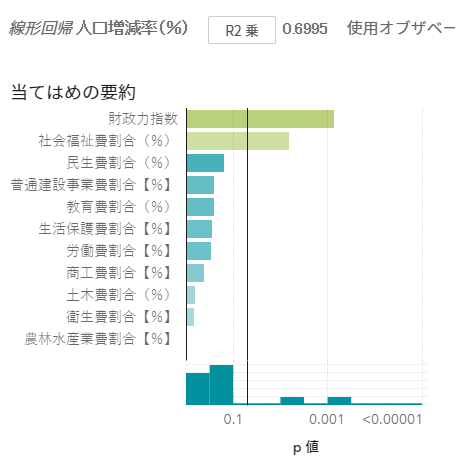
前回のブログではSAS Visual Analyticsを用いて地図上にデータを表示するジオマップの作成方法をご紹介しました。本記事では統計解析の一例として、線形回帰分析の方法をご説明します。 第1回和歌山県データ利活用コンペティション:大学生の部の課題は「人口減少問題を解決するための施策」でした。人口減少の原因を把握することは、施策を決定するうえで重要な過程の一つです。社会福祉や育児支援等、さまざまな要素がその原因の候補として考えられますが、どの要素が原因として最も妥当であるかを判別するために、各要素が人口増減に与える影響を線形回帰により分析します。本記事では、都道府県ごとの人口増減率と行政基盤との関係を例にとり、線形回帰の分析方法をご紹介します。 今回使用したデータは、総務省の「社会・人口統計体系 都道府県データ 社会生活統計指標 :D 行政基盤」と「人口推計:都道府県別人口増減率-総人口」です。 SAS Visual Analytics 8.3 における線形回帰の利用 from SAS Institute Japan データのインポート方法の記事はこちらです。 今回は連続型データの説明変数のみを分析しましたが、離散型データの説明変数も「分類効果」に設定することで分析可能です。また、説明変数同士に関係性がある場合は、それらを「交互作用効果」に追加します。 線形回帰のモデル評価において、「財政力指数」と「社会福祉費割合」のp値が有意水準0.05を下回っていたため、これらは説明変数として有効であると判断できます。「財政力指数」が高い自治体は多方面にわたり数々のサービスを提供可能で、「社会福祉費割合」が高い自治体は市民の生活の安定により多く貢献しています。これらのことから、市民の生活支援を充実させることが、人口増加のために行政のなすべき課題の一つであることがわかります。 しかし、今回作成した回帰モデルの決定係数は0.6995であり、依然として改善の余地が見受けられました。第一回和歌山県データ利活用コンペティションのサイトにこのテーマに関する優秀作品が掲載されておりますので、ご参照ください。 以上、線形回帰の方法をご説明しました。引き続き本ブログのシリーズではSAS Visual Analyticsを用いた図・グラフの作成や統計解析について紹介いたします。 第2回和歌山県データ利活用コンペティションへの参加も募集中ですので、高校生・大学生のご参加をお待ちしております。(追記:募集は締め切られました)
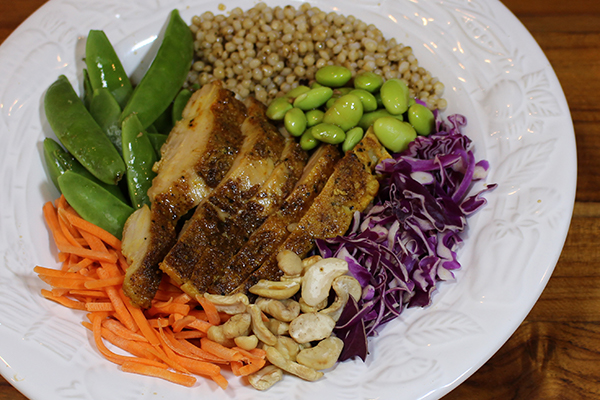

Move over salad, grain bowls have entered the room! Google ‘grain bowls’ and you’ll have a whopping 21,900,000 search results at your fingertips. Popular food trend? I’d say yes, and for good reason! Grain bowls are extremely versatile, quick to prepare, super satisfying and nutrient dense. They encourage mixing and
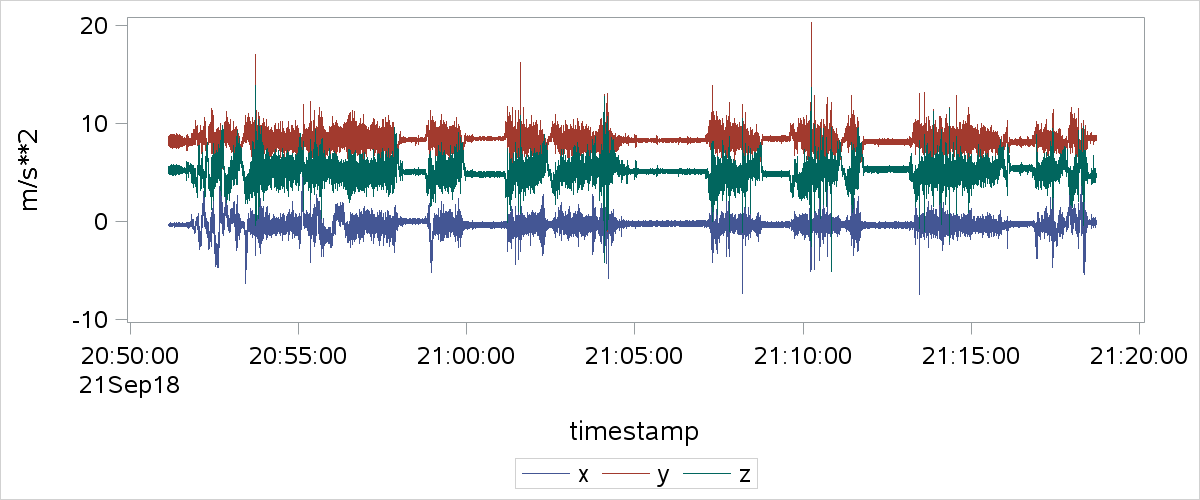

How to extract driving patterns by using smartphone sensors -- especially the accelerometer. With accelerometer readings in hand, you can use spectral analysis and other techniques to decompose events, and machine learning to match differentiate from patterns of risky drivers.
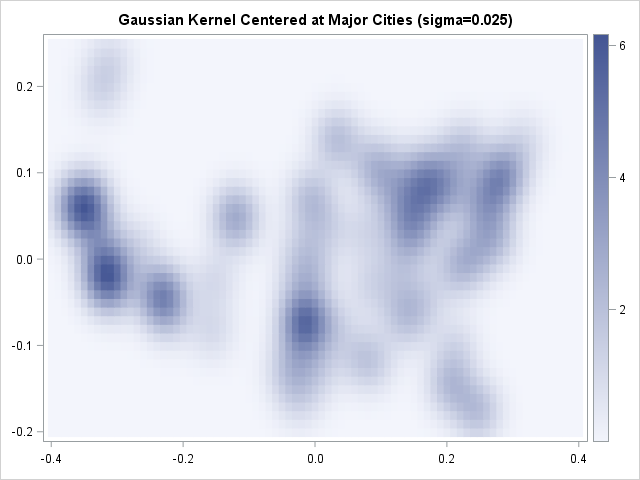

A radial basis function is a scalar function that depends on the distance to some point, called the center point, c. One popular radial basis function is the Gaussian kernel φ(x; c) = exp(-||x – c||2 / (2 σ2)), which uses the squared distance from a vector x to the


La analítica y la Inteligencia Artificial (IA) están rebasando las fronteras empresariales. Esto quedó de manifiesto en la versión 2018 de Analytics Experience (AX), un evento anual realizado por SAS, donde expertos y visionarios dieron cuenta de los alcances que estas tecnologías están registrando en diversas áreas del quehacer humano.
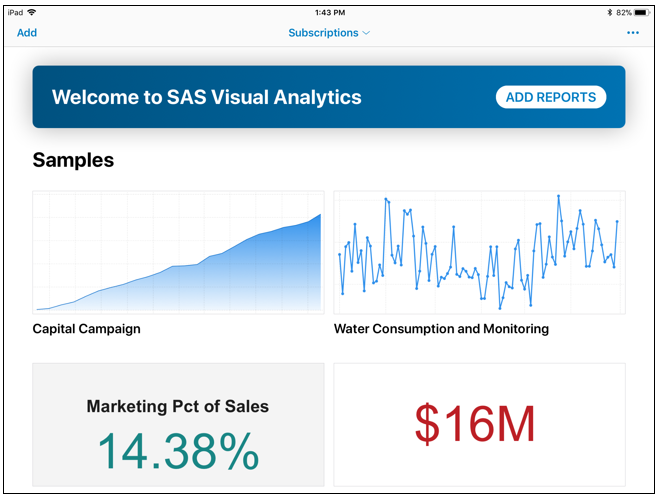

If you use SAS Visual Analytics and don’t have the SAS Visual Analytics app, you're missing out on a ton of convenience and interaction you could be having while on-the-go. This post outlines the app highlights.


David Loshin raises questions about what needs to be done to ensure quality analytics.
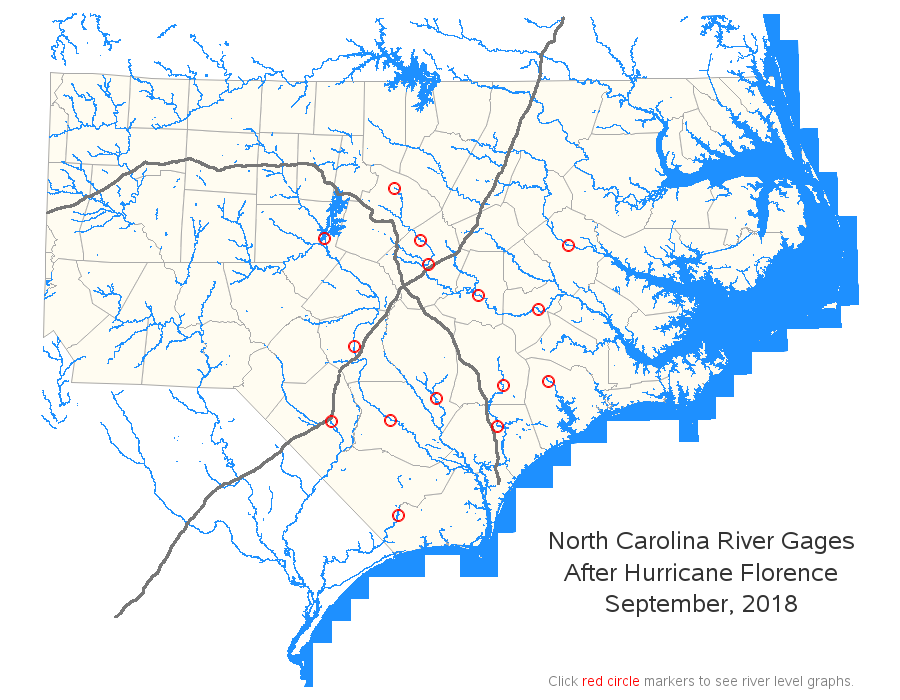

Here in North Carolina, a hurricane recently moved very slowly across our state, causing major flooding, and even closing miles of interstate highways for longer than a week. There is data available online for gauges along the river (or gages, as they call them), but I doubt many people know

Bold. Curious. Innovative. These words capture the spirit of our talented women in technology here, at SAS. That’s why we can hardly wait for the upcoming Grace Hopper Celebration – the largest gathering of women technologists – where we’ll join around 20,000 attendees to celebrate advancing women in technology! Much


Why is teaching and learning analytics so important? Recently, I interviewed two professors to gain their perspective on teaching students the skills they’ll need to pursue a lucrative career in the digital age. Joni Shreve, PhD, Faculty, Louisiana State University, explains: “We teach students analytics because there’s a talent gap
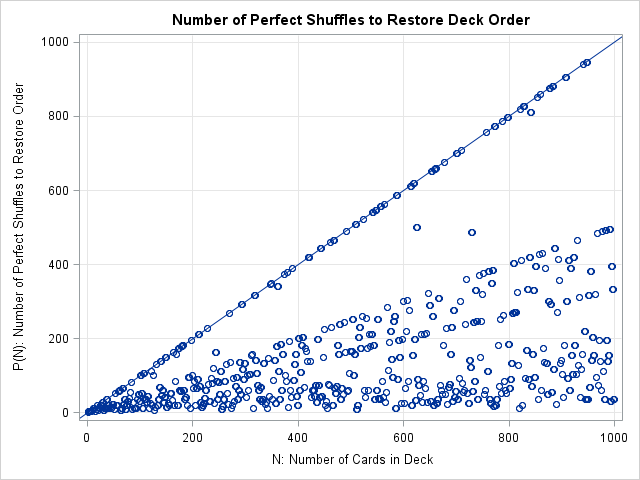
Last week I compared the overhand shuffle to the riffle shuffle. I used random operations to simulate both kinds of shuffles and then compared how well they mix cards. The article caused one my colleague and fellow blogger, Rob Pratt, to ask if I was familiar with a bit of


La disponibilidad de los datos y la capacidad de almacenar grandes volúmenes de información ha marcado un antes y un después para las compañías de todas las industrias, pues éstas han entendido que poseer datos no es suficiente, si no se cuenta con una estrategia analítica clara para maximizar su
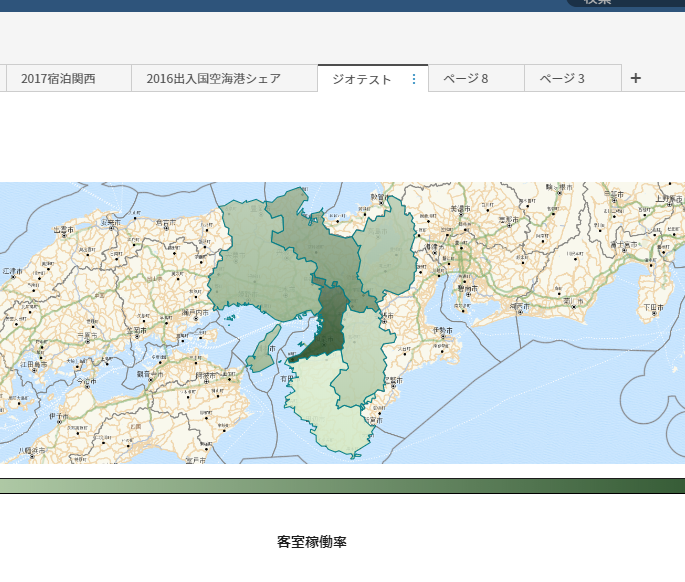
前回のブログでは、SAS Visual Analytics にデータをインポートする方法を紹介しました。こうしてインポートしたデータをもとに、さまざまな図表・グラフの作成や統計解析を実行することができます。本記事では地図上にデータを表示するジオマップの使い方を説明します。 第1回和歌山県データ利活用コンペティションでは、「観光客を誘客するための施策」と「人口減少問題を解決するための施策」が募集テーマとなっていました。施策を検討するためには、まず現状を把握することが重要です。観光客の誘客に関しては、年間の訪問者数、宿泊者数、消費額や訪問目的などが考えられます。人口減少問題に関しては、人口の増減率、年齢別の人口構成、転出先や転入元などが考えられます。これらのデータは地理情報を含んでおり、地図上に表すことで効果的な図を作成することができます。本記事の例では、和歌山県が属する関西地区の宿泊データを利用してジオマップを作成します。 まずは、観光庁の宿泊旅行統計調査から平成29年1月~12月分(年の確定値)の集計結果をダウンロードします。ダウンロードしたファイルをSAS Visual Analytics にインポートする方法は、前回のブログ記事を参考にしてください。 SAS Visual Analytics 8.3 におけるジオマップの利用 -宿泊旅行統計- from SAS Institute Japan ジオマップをもとに調査をすすめると、和歌山県の宿泊稼働率が比較的低い要因を知ることができました。客室稼働率を高めるには、季節変動を抑え、年間を通じて旅行者を集客することが重要であるといえそうです。 つぎに、第2回のテーマである「高齢者が活躍できる社会づくり」「UIターン就職・若者の定住促進」に関連するデータを利用した例です。このスライド内では、時系列データを利用したアニメーション形式のジオマップ作成を紹介しています。時系列データに関しての詳細は、こちらのブログ記事を参考にしてください。 SAS Visual Analytics 8.3 におけるジオマップの利用 -高齢者の就労- from SAS Institute Japan ジオマップを用いてデータを図示することで、地域比較がより分かりやすくなり時系列の変化も直感的に把握することができます。また、分析を進めるための手がかりともなります。今回のコンペティションでは地理情報を含むデータの利用が予想されますので、その際はぜひジオマップを活用してみてください。 引き続き本ブログのシリーズでは、図表・グラフの作成や統計解析の方法について紹介いたします。 第2回和歌山県データ利活用コンペティションへの参加も募集中ですので、高校生・大学生のご参加をお待ちしています。(追記:募集は締め切られました)

If you were to ask Tricia Wang, PhD, about real business growth, she would tell you that it lies outside the boundaries of the known. Not everything valuable is measurable, she would say. And big data is hiding new customers in the market from you. Wang is more than just