All Posts
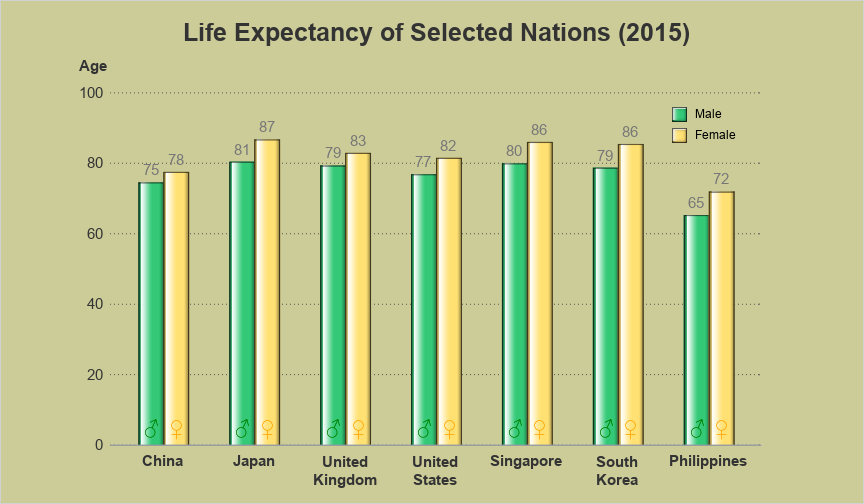

You might have noticed I've been trying out SAS ODS Graphics lately, whereas in the past I mainly used SAS/Graph for my samples. In this blog post I step you through my latest fancy SGplot graph - hopefully you'll learn some tips & techniques, as you follow along. (I don't


2019년에도 인공지능(AI)은 여전히 모든 기관 및 조직들에게 큰 화두일 것으로 보입니다. 인공지능 기술을 통해 기관은 대량의 데이터를 빠르게 분석하고 반복적인 업무 프로세스를 자동화하며, 투명성을 높임으로써 전반적인 운영 효율을 개선할 수 있습니다. 이러한 혁신은 이제 더 이상 첨단 IT 기업들만의 성공 사례가 아닙니다. 새해를 맞이하여 공공 기관이 효과적으로 AI 전략을 구현하기


In my blog, Deciding to Adopt, I mentioned sharing 4 podcasts about adoption that I recorded with Darius Moore and Alex Kelly with the Children's Home Society of NC. Here are the second two podcasts on "Adopting in NC" and "Cross-cultural Fostering and Adoption". Adopting in NC Cross-cultural Fostering and


El tiempo corre; se aproxima cada vez más la entrada en vigor de IFRS 17 (International Financial Reporting Standard). No obstante, la decisión de IASB para retrasar 12 meses más la entrada en vigor de esta norma (para el primer día de 2022), las empresas aseguradoras de gran parte del


It's a busy time in gyms and on the greenways as people embark on this year's resolutions or better yet, goals, to become healthier this year. For those who are grumpy about traffic in the gym, consider that you too were once in their shoes and be kind. Whether you
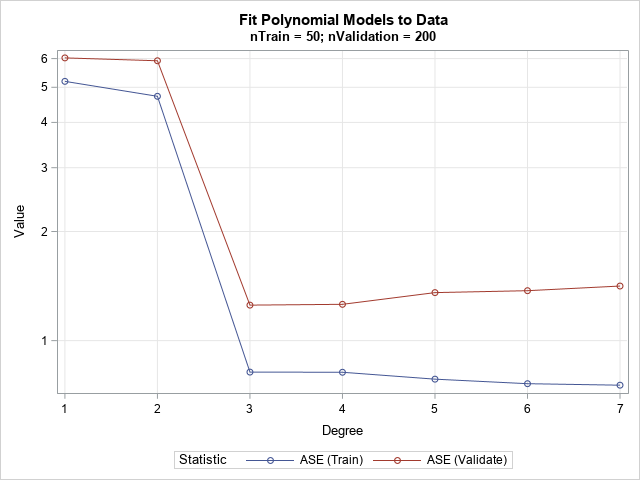

Machine learning differs from classical statistics in the way it assesses and compares competing models. In classical statistics, you use all the data to fit each model. You choose between models by using a statistic (such as AIC, AICC, SBC, ...) that measures both the goodness of fit and the
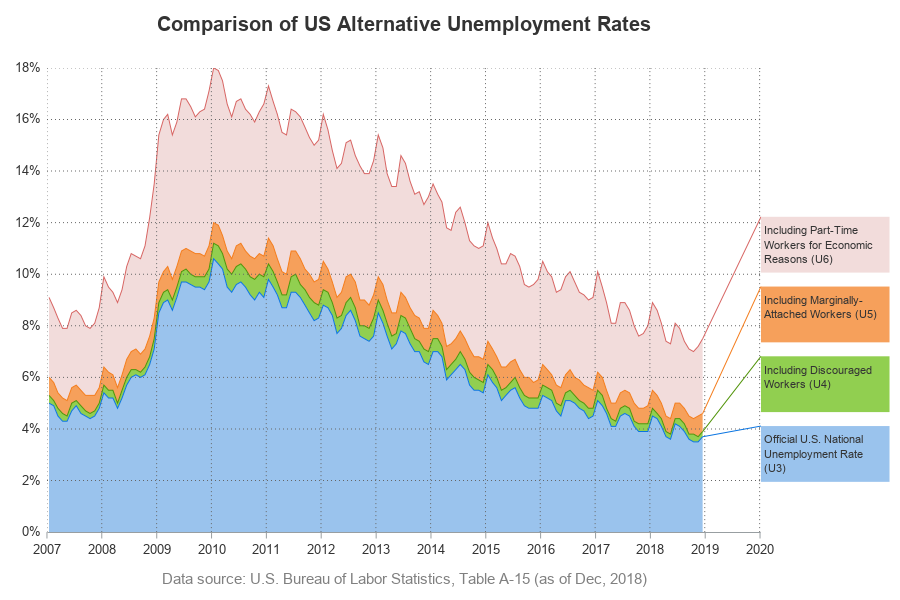
Many areas of the US are experiencing record low unemployment. This is great at the national level, and also great at a personal level (for example, I now have fewer unemployed friends asking to borrow money!) But just how low is the US unemployment rate, and how does it compare


January serves as National Slavery and Human Trafficking Awareness Month, culminating in the annual observation of National Freedom Day on February 1. For many, this month presents an opportunity to refocus efforts to slow, and ultimately stop, human trafficking around the globe, but especially here in the United States. The


By almost any measure, Rick Wicklin is the most prolific and most popular blogger at SAS. Author of The Do Loop, Rick has been writing and publishing blogs at SAS since 2010, and today he publishes his 1,000th post on The Do Loop! To celebrate, I want to highlight some
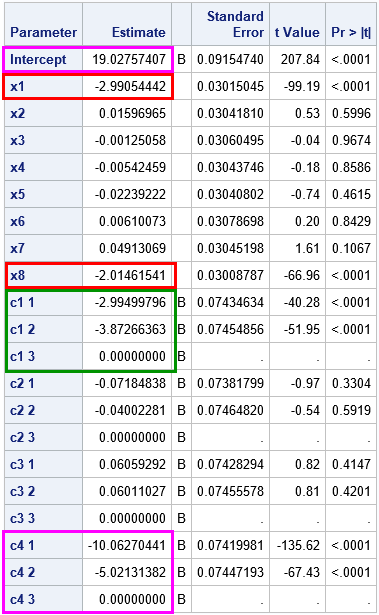
This article shows how to use SAS to simulate data that fits a linear regression model that has categorical regressors (also called explanatory or CLASS variables). Simulating data is a useful skill for both researchers and statistical programmers. You can use simulation for answering research questions, but you can also


Brush up on the latest news around data privacy. Todd Wright shares his top 10 picks.


A nadie le gusta pagar impuestos. Y no son pocos los contribuyentes -personas físicas y morales- que buscan formas de declarar ingresos más bajos que los reales con tal de desembolsar lo menos a las autoridades fiscales (como el Sistema de Administración Tributaria de México). De hecho, estas organizaciones son


“Hoy fue revelado un prototipo de computadora que se espera, sea capaz de hablar, caminar, ver, escribir, reproducirse y ser consciente de su existencia”. Allá por 1958, cuando aun cuando no existía internet y una computadora era algo más pesada que un elefante, el New York Times publicaba un artículo
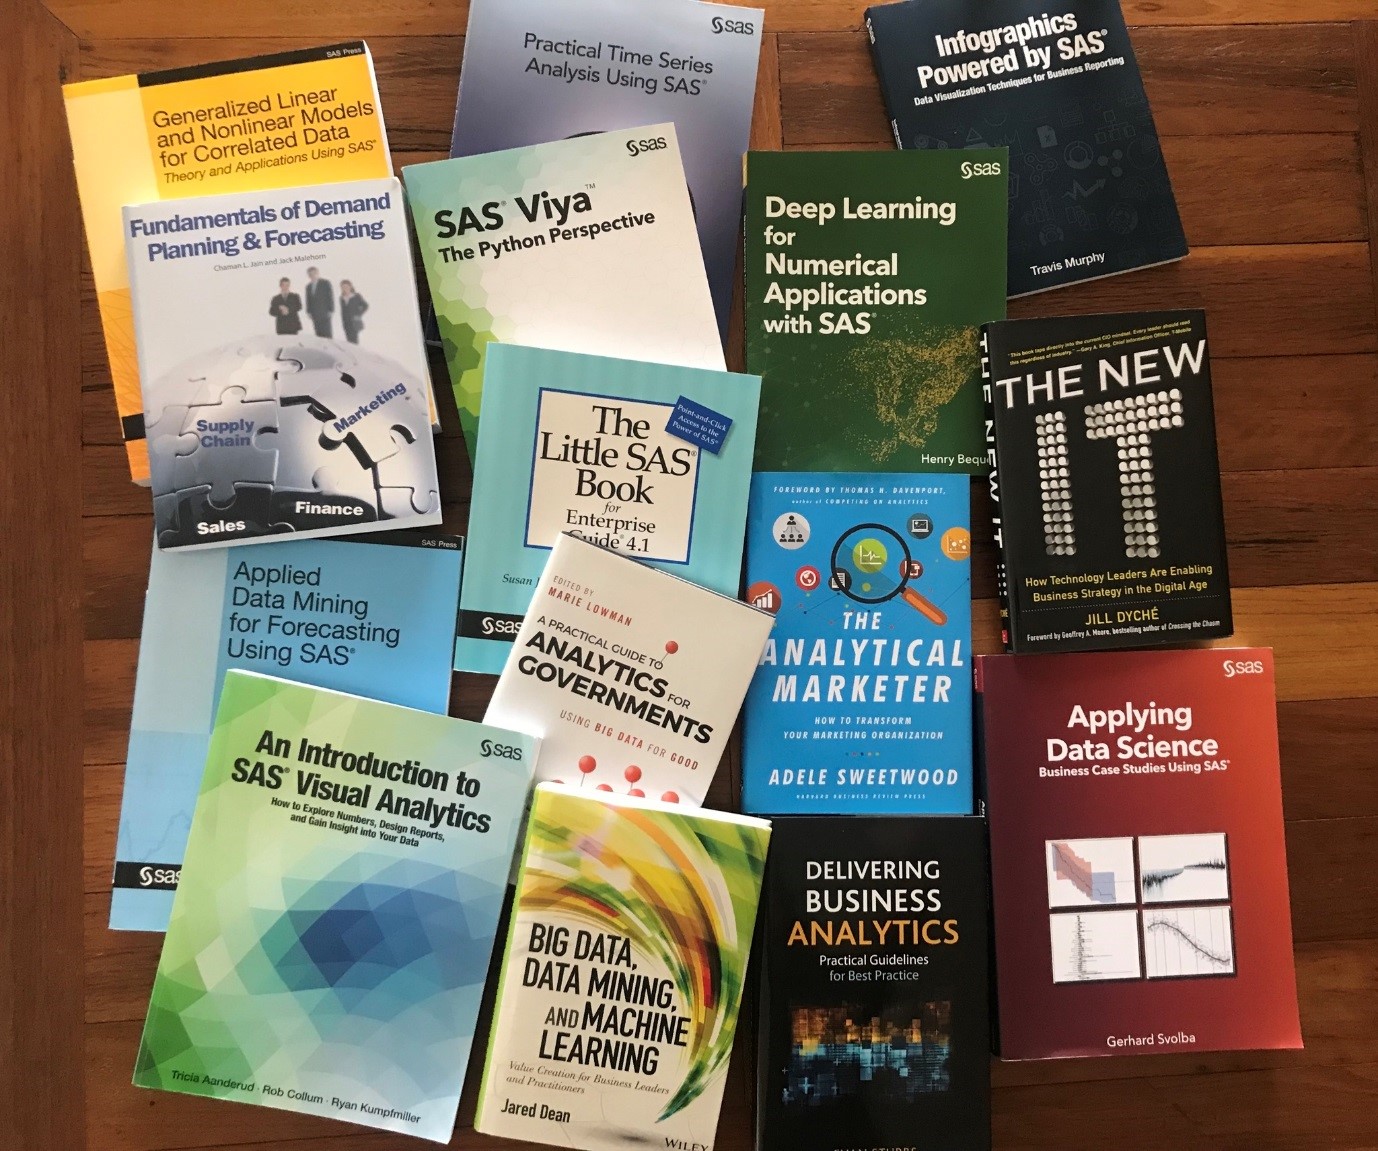

Michelle Homes explains how SAS Press books changed her life, and how she donates her books and time to the SAS community whenever she can.


Many of the buzzy applications of AI in healthcare we hear about involve medical IoT, computer vision for radiology or disease prediction. But the fact is, many health institutions that just aren’t there yet with adoption. With limited budgets and dated systems, can public health agencies tap into the power