All Posts


From saving cheetahs to preserving fresh water systems, analytics plays a role in many inspiring conservation projects around the world. Read on to learn about a few of our favorites. 1. Protecting animals from extinction Learn how analyzing footprints could help save cheetahs in Namibia and other endangered animals around


No início deste mês tive o prazer de participar como speaker no evento Platform Roadshow – Road2AI promovido pelo SAS. Nesta conferência foram abordados diversos temas interessantes, entre eles Inteligência Artificial, Cloud, Ofertas SAS adequados a diversas expertises. Sob a minha responsabilidade ficou o tema SAS e Open Source –
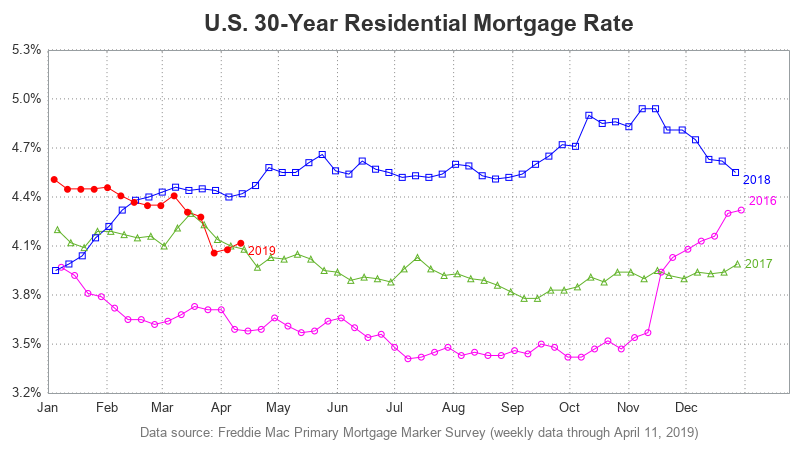

While we're on the topic of mortgage rates, let's explore another technique for plotting and comparing the rate data over several years. Last time, we plotted each year's data in a separate graph, and paneled them across the page. This time, let's overlay multiple years together in the same graph.


Imagine a world where satisfying human-computer dialogues exist. With the resurgence of interest in natural language processing (NLP) and understanding (NLU) – that day may not be far off. In order to provide more satisfying interactions with machines, researchers are designing smart systems that use artificial intelligence (AI) to develop


Phil Simon says that the downsides of even a few discrepancies can be enormous.


A few weeks ago, our team moved into SAS’ newest building, Building A. It’s a beauty, featuring a world-class training center, a bakery, and over 1000 pieces of artwork. While the abundance of baked goods is hard to beat, I think my favorite part about the building is the view.
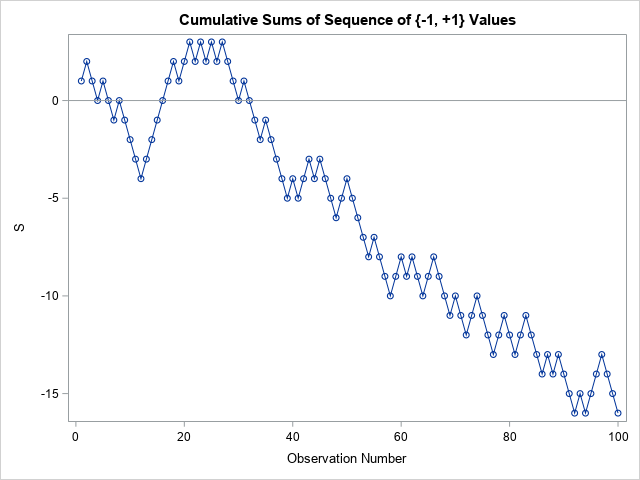

Many statistical tests use a CUSUM statistic as part of the test. It can be confusing when a researcher refers to "the CUSUM test" without providing details about exactly which CUSUM test is being used. This article describes a CUSUM test for the randomness of a binary sequence. You start
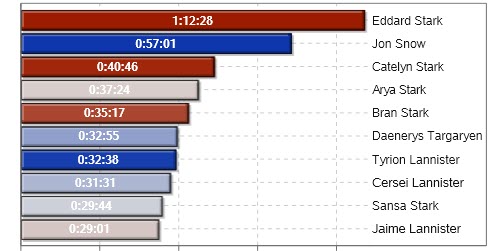

By using data provided by a Game of Thrones fan, we use SAS to look at screen time for scene locations and characters in this crazy popular show.


The financial services industry is under continued pressure to create more convenient ways of paying for goods and services. This trend goes beyond common hype. It’s a cultural shift from long-standing payment methods traditionally defined by industry heavyweights to embracing market demands and delivering customer-centricity. With digitisation, new market entrants


At SAS, we have a multidimensional culture that blends our different backgrounds, experiences, and perspectives from employees all over the world. As the Diversity and Inclusion Manager, I’ve had open conversations with employees regarding the value that neurodiversity brings to the creative process and to our organization. But I’m not the


Articolo tradotto e integrato dal post originale di Laurent Colombant In una recente survey della società di consulenza PWC è stato stimato che le frodi nei processi di procurement erano il secondo crimine economico più denunciato a livello mondiale. Si tratta di un termine ampio, che comprende di tutto, dalla
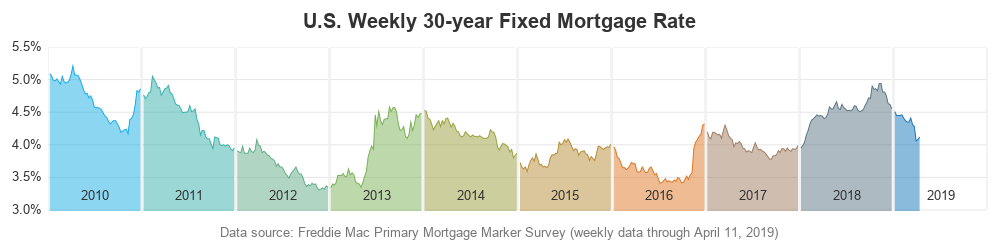
Did you recently lock in a mortgage rate of 3.5-5%, or perhaps even lower? How do today's rates compare to rates in the past? Let's dig a little deeper into this topic, with some graphs! But before we get started, here's a picture to get you into the mood for


The journey of life rarely follows the expected path. Last year around this time I experienced the most devastating loss I will likely ever experience in my life; the loss of our only daughter, Mamie. The grieving process is new to me, as is the earth-shattering devastation of unfulfilled hopes,
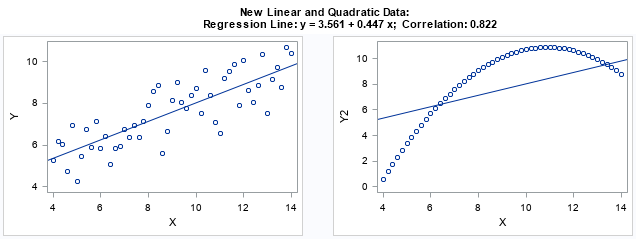
I think every course in exploratory data analysis should begin by studying Anscombe's quartet. Anscombe's quartet is a set of four data sets (N=11) that have nearly identical descriptive statistics but different graphical properties. They are a great reminder of why you should graph your data. You can read about

This blog post is based on the Code Snippets tutorial video in the free SAS® Viya® Enablement course from SAS Education. Keep reading to learn more about code snippets or check out the video to follow along with the tutorial in real-time. Has there ever been a block of code