All Posts


More and more business applications, including advanced analytics, are moving into the cloud. The advantages are obvious: agility, innovation and cost-efficient high performance. However, many cloud migrations fail to unlock its full potential. To maximize the performance and value of analytics in the cloud, companies need to balance options and
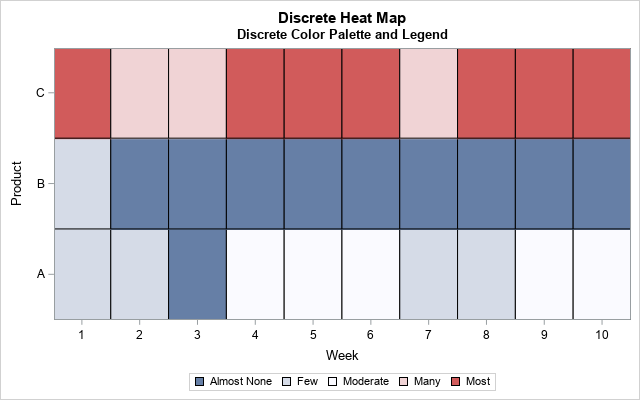

Heat maps have many uses. You can use a heat map to visualize correlation matrices, to visualize longitudinal data ("lasagna plots"), and to visualize counts in any two-dimensional table. As of SAS 9.4m3, you can create heat maps in SAS by using the HEATMAP and HEATMAPPARM statements in PROC SGPLOT.


인공지능(AI) 기술은 더 이상 공상 과학소설 속 제재가 아닌 기업이 마주한 현실이 되었습니다. 오늘날 기업들은 머신러닝, 알고리즘, 스마트형 커넥티드 제품 등 다양한 AI 기술을 새롭고 흥미로운 방식으로 비즈니스에 적용하고 있습니다. 딜로이트(Deloitte)에서 이러한 인지기술(cognitive technologies)을 적극적으로 도입하는 기업들을 대상으로 진행한 최근 설문조사에 따르면, 응답자 중 76%가 AI를 비롯한 인지기술이 3년 이내에
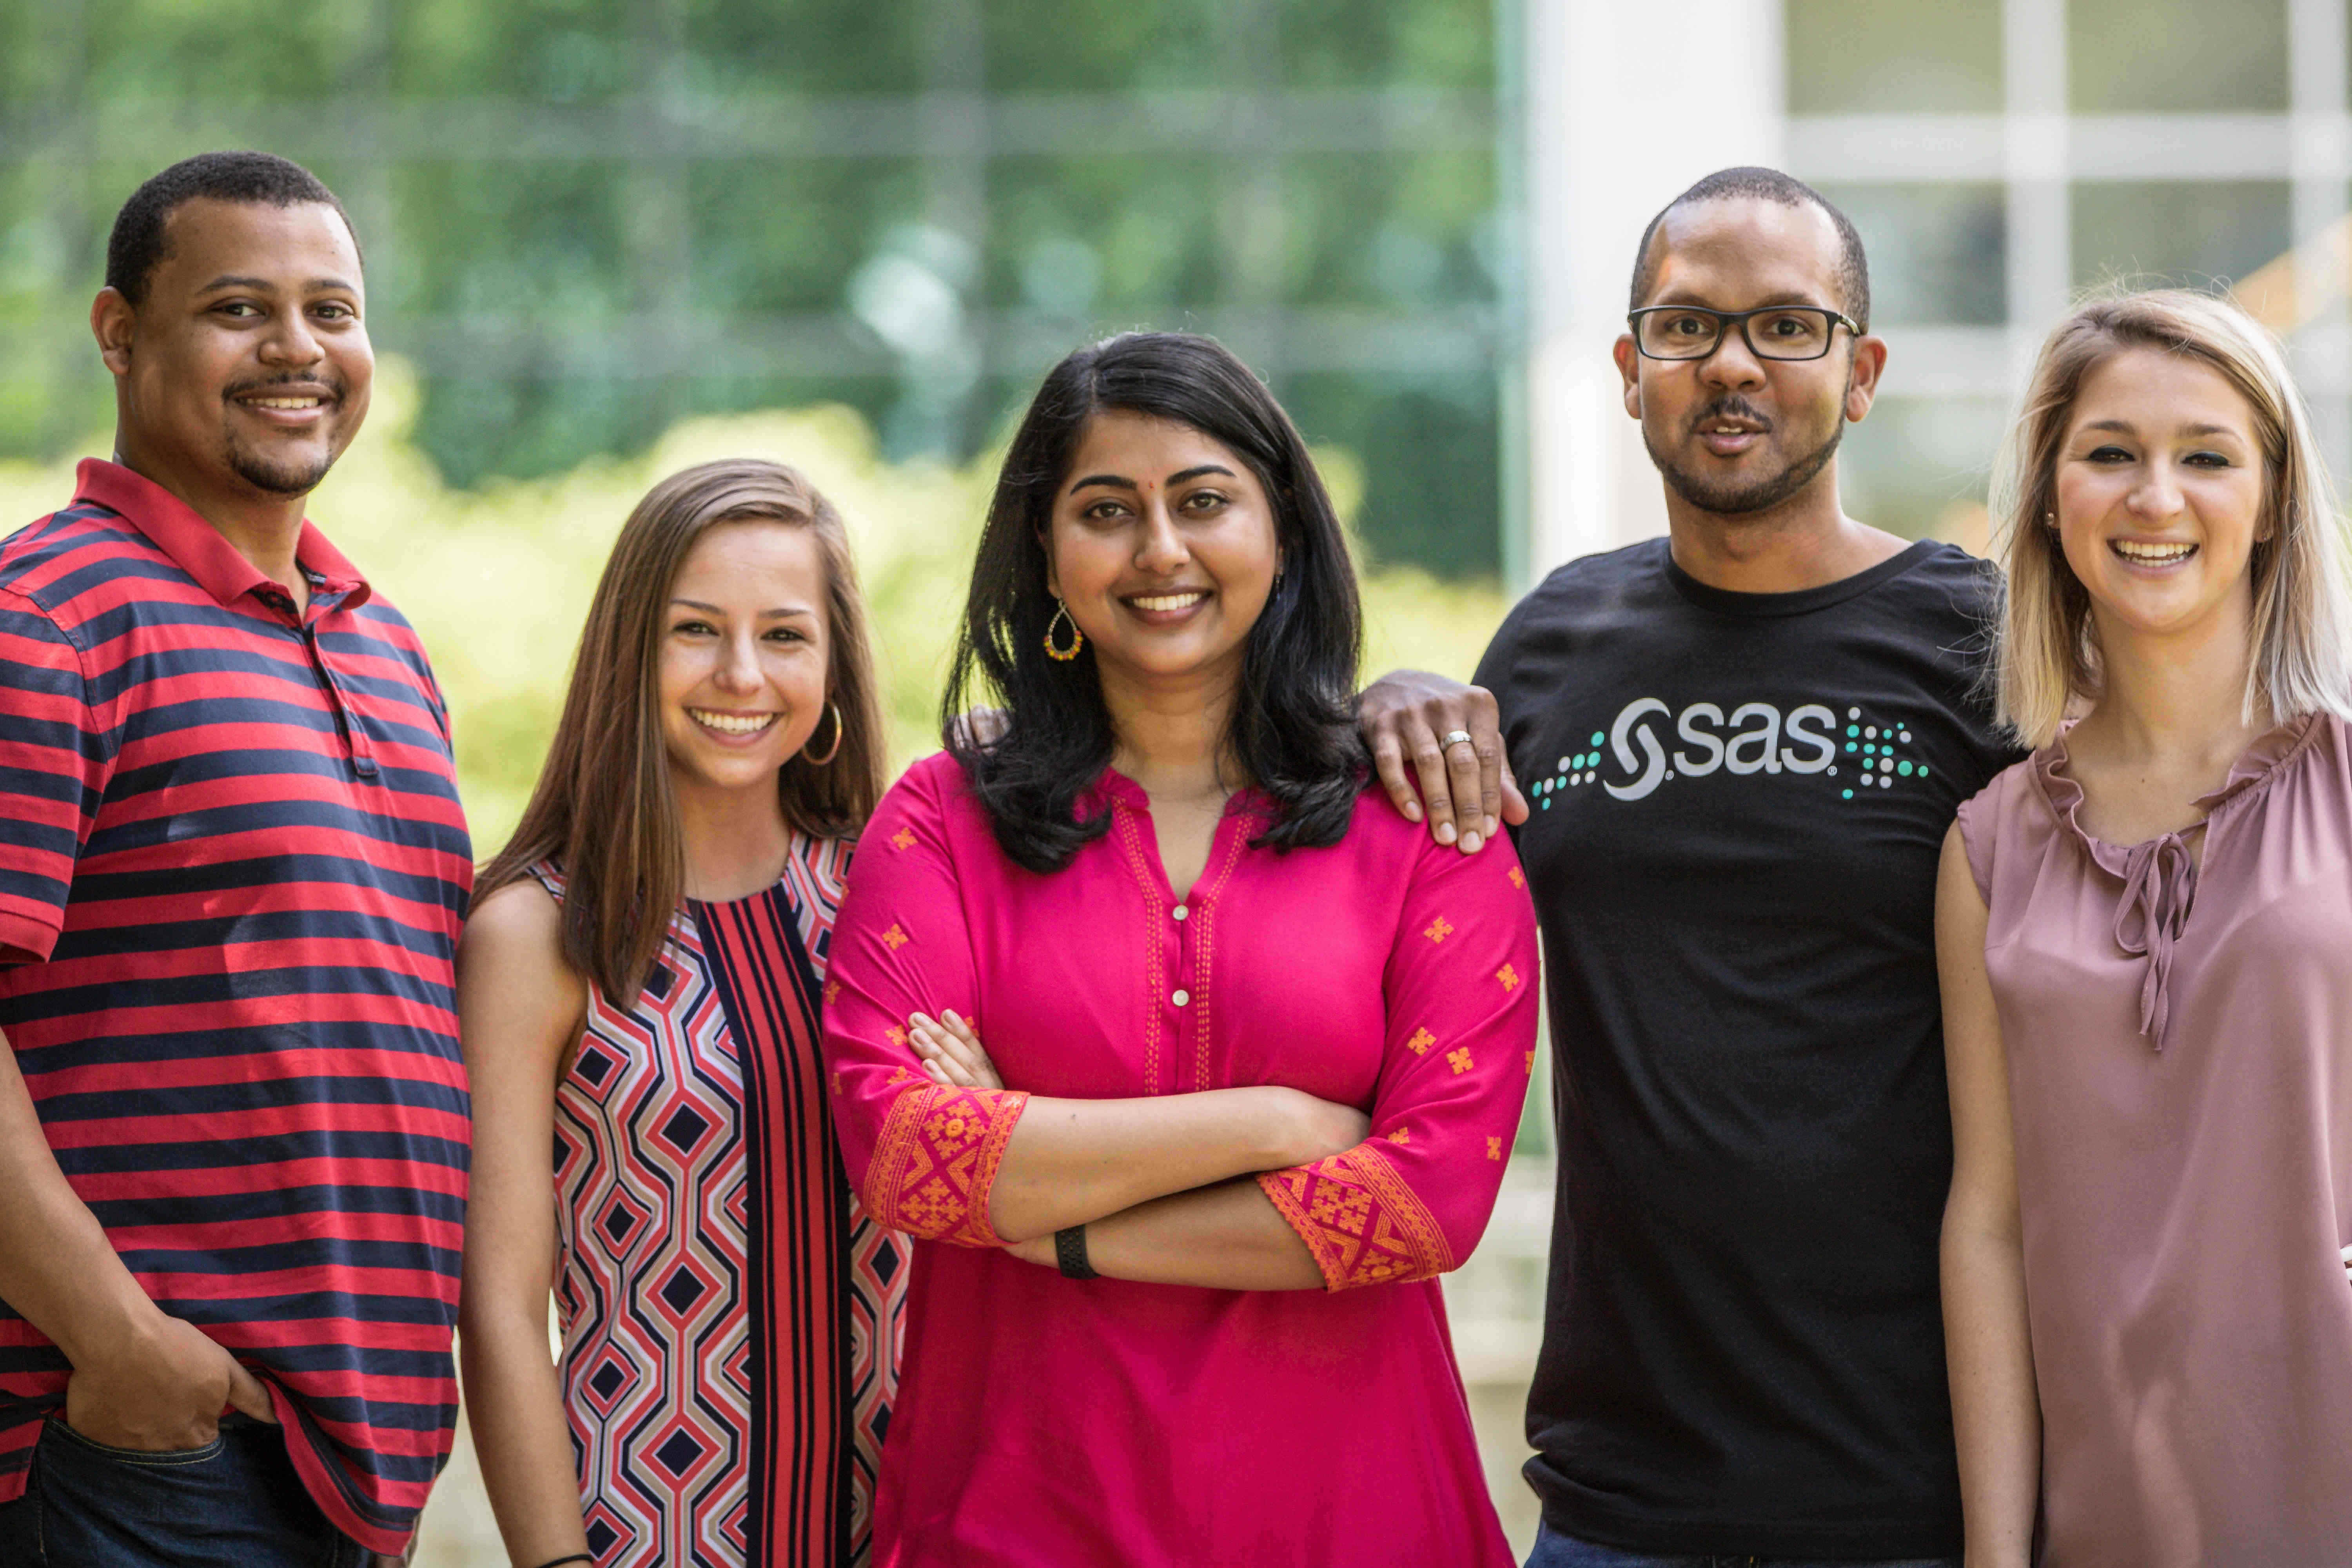

At SAS, we’re proud to have a multidimensional and multi-generational workforce. Our CEO, Dr. Jim Goodnight, says it best: “We believe a diverse workforce brings unique talents and inspires teams to create software that changes the world. Great minds don’t always think alike, so we make it a priority to
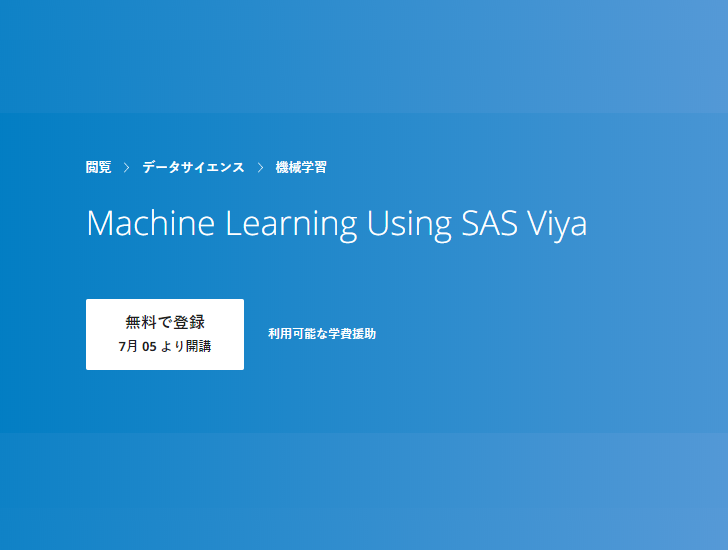
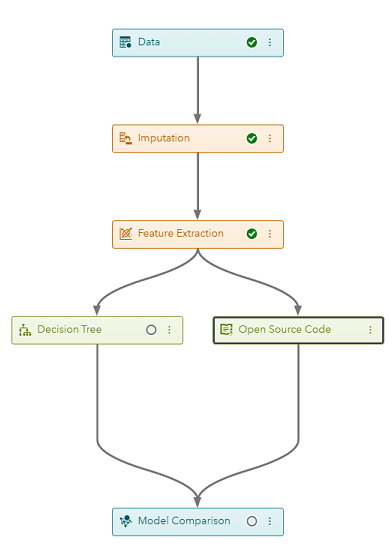
現在、機械学習が大ブームを巻き起こしており、各種ビジネスへ応用拡大の勢いはとどまるところを知りません。一方で、「“機械学習”という名前は聞くけど、よくわからない…。」、「“機械学習”について学んでみたいけど、プログラミングに自信はない…。」などと考えている方も少なくないはずです。そこで本記事では、煩わしいプログラミングなしで機械学習が学べる「Machine Learning Using SAS Viya」という学習コースについてご紹介します。 「Machine Learning Using SAS Viya」は、オンライン学習プラットフォーム、「Cousera」のコースの一つです。SAS Viya for LearnersというSAS の教育用環境を使用し、オンライン上で実際に手を動かしながら機械学習の基礎を学べます。GUIでの操作が基本であるため、プログラミングに自信のない方でも取り組めることが特徴です。本コースは六週間分のパートに分かれており、無料で教材の内容全ての閲覧が可能です。また、コースを購入すると採点機能の利用や修了証の発行などの機能も利用可能です。コースの言語は英語で、コース内動画は英語字幕に対応しています。 シラバスは以下のとおりです。 Week1:Getting Started with Machine Learning using SAS® Viya® Week2:Data Preparation and Algorithm Selection Week3:Decision Tree and Ensembles of Trees Week4:Neural Networks Week5:Support Vector Machine Week6:Model Deployment 本記事ではWeek1・Week2の内容を各セクションごとにご紹介します。 Week1:Getting Started with Machine Learning using SAS® Viya®

Are you a seasoned data scientist looking for a fast, all-inclusive machine learning solution? Curious about machine learning but have little to no programming experience? Interested in using AI to take over the world? Follow my lead and use SAS VDDML to fast track your world domination. This blog is


Some people still associate artificial intelligence (AI) with robots taking over the world. There's a lot of hype around self-driving cars and personal robots. However, there are far more realistic and beneficial examples of AI in everyday life. AI is the science of training systems to emulate human tasks through


Las organizaciones se enfrentan a la creciente demanda de analítica de alto rendimiento que produzcan resultados rápidos y confiables. La transformación digital y el análisis empresarial son una prioridad en la agenda de muchas organizaciones. Para los CIO en sus organizaciones, significa una oportunidad para habilitar el valor a escala

SAS Japanでは昨年末より”Data for Good”の達成を目指す学生コミュニティ「SAS Japan Student Data for Good community」を運営しています。このコミュニティでは生物の絶滅と人類との関係の分析や通勤ラッシュ時の鉄道混雑緩和など、データを活用した社会課題の解決に取り組んでいます。 二回目となる今回の勉強会では、DataKind社の事例から精神疾患に苦しむ人の生活の向上をテーマに、課題の設定方法をメインに学びました。 精神疾患に苦しむ人々に質の高いケアを提供する 今回扱った事例は、Data for Goodを推進する社会団体であるDataKind社とイリノイ州シカゴで精神疾患の患者を支援している非営利団体であるThresholdsが共同で行ったプロジェクトです。 精神疾患の患者が引き起こす傷害事件や、自殺者の増加、子どもの登校拒否など、精神疾患が原因の社会問題はアメリカにも深刻な影響を与えています。Thereholdsは治療機会や住居の提供を通して精神疾患のある人々の支援を行ってきましたが、資金/人手不足により精神疾患患者に質の高いケアを提供することは困難を極めていました。 そこでDatakind社と共同プロジェクトを開始し、「支援を優先すべき患者を把握する」ことで限られたリソースの中で質の高い支援を行うことを目指しました。このプロジェクトでは、実際のアプローチとして 患者データを一括管理できるデータウェアハウスの構築 支援者が使いやすいダッシュボードの作成 患者間のリスクスコアリングのための予測モデリングの基礎の開発 に取り組んでいます。 3の予測モデリングでは、支援を優先すべき患者を予め把握することで問題解決につなげることを目的にしています。今回のプロジェクトで予測モデリングの土台を築き上げられたことから、今後は精神疾患患者の支援に最良な意思決定のサポートができるようになる見込みです。詳しい内容は記事DataKind社の事例紹介(英語)をご覧ください。 解くべき課題を設定する DataKind社は「支援を優先すべき患者を把握する」ことで資金や人手不足の中でも質の高いケアを提供することに挑みました。 では自分たちならこの問題のどの部分に着目して「課題設定」を行い、その課題を解くにはどのようなアプローチが考えられるのか議論しました。 その中で興味深い意見としては、 課題を「精神疾患の早期発見」と設定し、その解決策として「異変に気付きやすい周りの家族・友人が、簡易的に精神疾患をチェックでき、次にとるべき行動を示してくれるアプリケーション」 といったものがありました。 このアプローチは急な病気やけがの際にインターネット上で緊急度を確認できる救急受診ガイド(東京消防庁)と似た発想であり、どちらも限られたリソースを上手く活用するために機械で判断が可能な部分は機械に任せ、人間がより重要な仕事に時間を割けるようにする取り組みといえます。 上記以外にも様々な意見を交わし、課題の設定方法を学びました。 普段私たちは与えられた課題を解くことはあっても、自分たちで課題を設定する機会はあまりないように思えます。しかしデータ分析において課題の設定は非常に重要で、勉強会を通して意見を共有しながら議論を進められたのは、私たちが取り組んでいるプロジェクトを考える上でも参考になりました。 コミュニティメンバー募集中! SAS Japan Student Data for Good communityでは引き続き学生の参加者を募集しております。社会貢献を目指す活動を通してデータサイエンティストの役割である「課題の設定」から「データを用いた解決法の提示」までの一連の流れを経験できます。 興味をお持ちでしたら下記の事項をご記入の上JPNStudentD4G@sas.comまでご連絡ください。 大学名 / 高校名 名前 メールアドレス また、第4回を迎える学生向けセミナー「データサイエンティストのキャリアと活躍のかたち」 は2019年7月25日(木)19:00~ SAS東京本社(六本木ヒルズ11F)にて開催予定です。 現場で活躍されているデータサイエンティストの方々から、具体的なお仕事の内容や学生の内に学ぶべきこと等をお伝えする予定です。 みなさんのご参加お待ちしております。
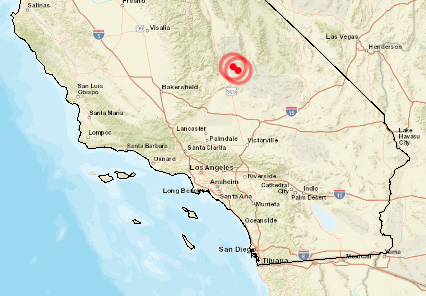

Earthquakes have been in the news lately - in particular, two very strong earthquakes that recently hit California. Exactly where did they hit? ... Let's plot it on a map! But before we get busy analyzing the California data, here's a picture to get you in the mood for studying

I was sitting in a model railroad club meeting when one of our more enthusiastic young members said, "Wouldn't it be cool if we could make a computer simulation, with trains going between stations and all. We could have cars and engines assigned to each train and timetables and…" So,


It’s been dubbed “the most important body system that you’ve never heard of.” The endocannabinoid system (ECS) was discovered in the early 1990’s. It’s not a structural system like the nervous or vascular systems. Instead, the ECS is made up of a network of receptor sites in almost every part


Technology is transforming our lives. It's revolutionising the way we buy groceries, send gifts, listen to our favourite music, communicate with loved ones, and much more. Because it's so convenient and ubiquitous, we expect ultra-fast and highly personalised services from all the companies we engage with. As a result, businesses
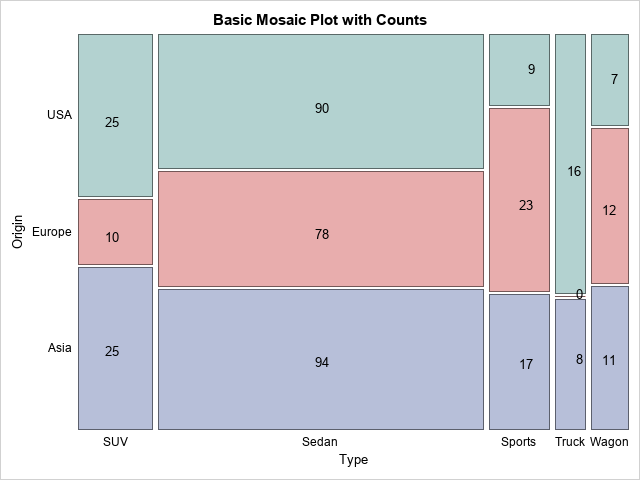
I recently showed how to create an annotation data set that will overlay cell counts or percentages on a mosaic plot. A mosaic plot is a visual representation of a cross-tabulation of observed frequencies for two categorical variables. The mosaic plot with cell counts is shown to the right. The


I recently heard a parent say that the only day better than the day that the kids get out of school for break is the day they go back. As parents, we long for the relaxed weekends free of projects and the lazy evenings at the pool. But when school