All Posts


I recently hosted a Digital Dial-Back Challenge. For two weeks participants chose a form of technology they wanted to assess and potentially reduce their use of. This was not a detox. Instead, by creating a plan including strategies and "alternative actions", participants found increased opportunities to be aware of their


この記事はSAS Institute Japanが翻訳および編集したもので、もともとはIvor G. Moanによって執筆されました。元記事はこちらです(英語)。 Webセミナー「Data Preparation in the Analytical Life Cycle」について このWebセミナーでは「アナリティクス・ライフサイクルにおけるデータ準備」というテーマを取り上げ、データ準備の定義と、このライフサイクルの各ステップについて論じています。最初に現在の市場状況とデータ準備に関する人々の見方を考慮に入れた上で、議論の対象は、アナリティクス・ライフサイクルを構成する様々な領域と、データ準備が果たす役割へと移ります。そして最後に、データ・ガバナンスの役割を検討します。この簡潔版のブログ投稿シリーズでは、同Webセミナーから、いくつかの主題を取り上げて論じています。 この投稿は、アナリティクス・ライフサイクルにおけるデータ準備の役割に関するWebセミナーに基づく投稿シリーズの第2弾です。第1弾では、データ準備がアナリティクス・ライフサイクルの中にどのようにフィットするかを論じました。この投稿では、データ準備に関するいくつかのトレンドと、その結果として進化を遂げた構造やプロセスのいくつかを取り上げて検討します。現在のデータ準備パターンの形成を推進してきた主な課題は2つあります。それは、顧客需要に関する課題とデータ品質に関する課題です。 顧客需要 データ準備に関する現状の大部分は、データ量とデータソース数の増大によって推進されています。ビッグデータの出現は、データ・フォーマットの種類の増加や、ソーシャルメディアやマシンセンサーのような新しいデータソースの出現と相まって、データの保管や利用が難しくなることを意味しました。それと同時に、組織や企業は「意思決定をサポートするためにデータを効果的に活用することが、ますます必要不可欠になっている」ということを認識するようになりました。 ユーザーはより一層多くのデータを必要としています。彼らは手元のデータと外部のデータの両方を分析に含められるようになりたいと考えています。セルフサービスの人気が高まっているのは、柔軟性と自律性が高く、より低コストで、より高速であることに加え、統制も容易だからです。また、他の部門のために行う作業が減少します。 ガードナー社は以前、次のようにコメントしました。「セルフサービス型のデータ準備ソフトウェアの市場は、2019年までに10億ドル(1,100億円、1ドル110円換算)に達し、16.6%の年間成長率を示すと想定されます。潜在的なターゲット・ユーザーにおける現在の導入率は5%であり、これが2020年までには10%以上に成長すると想定されます。ベンダーは自社のビジネス戦略を計画する際に、この市場機会を理解しなければなりません」。しかしながら、セルフサービスのこうした急速な普及は、データサイエンティストにとって頭痛の種を生み出します。セルフサービスは高品質なデータ準備を必要としますが、残念ながら、それには時間がかかり、近道はほとんど存在しません。 データ準備工程からアナリティクス工程へのスムーズな遷移は極めて重要です。その実現には強力なアナリティクス機能とビジュアライゼーション機能が必要となりますが、ユーザーが必要な情報をデータから素早く引き出せるようにするためには強力なデータ管理も必要です。 データ準備工程からアナリティクス工程へのスムーズな遷移は極めて重要です。その実現には強力なアナリティクス機能とビジュアライゼーション機能が必要となりますが、ユーザーが必要な情報をデータから素早く引き出せるようにするためには強力なデータ管理も必要です。動きの速い市場では、俊敏な企業になる必要があります! こうした状況を受け、多くの企業では、データ準備やソフトウェア・エンジニアリングを担当するデータエンジニアという新たな職務役割が台頭しています。データエンジニアの仕事は、分析モデルの作成を行うデータサイエンティストにデータを渡す前に行われます。 データ品質の重要性 この新しい台頭中のデータエンジニアという仕事の役割は、データ品質が不可欠であるという事実の認識が広がっていることの証と言えます。言い換えると、データ管理とは、データの収集や整形を行うことだけでなく、データの品質が適切である状態を確保することでもある、ということです。したがって、データ品質は、データ準備の領域においても必要不可欠なテーマとなりつつあります。 SASは以前から、この領域の先頭を走り続けてきました。我々は相当以前から、「データ準備は単なるデータ読み込みに留まらない工程であり、データ品質の問題も含める必要のある工程である」と認識していました。アナリティクス手法はその入力として、価値の高いデータを必要とします。入力データがクリーンかつ高品質でない場合、出力はそれに応じて劣悪なものとなります。なぜなら、アナリティクス手法には、「ゴミを入れれば、ゴミしか出てこない」という格言がまさに当てはまるからです。 入力データがクリーンかつ高品質でない場合、出力はそれに応じて劣悪なものとなります。なぜなら、アナリティクス手法には、「ゴミを入れれば、ゴミしか出てこない」という格言がまさに当てはまるからです。 データの確認と修正 例えばSAS® Data Preparationでは、ユーザーは、どのようなデータがインポート済みで、どのようなデータが利用できるかを見ることができます。ユーザーはデータのサンプルを見てその感触を得ることができ、初見の段階で全てが一目瞭然です。しかも、ユーザーはデータ・プロファイルを見れば、もう少し詳しい情報を確認することもできます。プロファイルには、データが様々な形態で保管されている(例:正式名称と略語が混在している)という情報が示される可能性があります。こうしたデータ状態は、分析モデルに深刻な問題を引き起こしかねないため、複数の異なるデータソースを統合する前の段階で解決されなければなりません。 したがって基本的には、そのデータには今すぐ修正や標準化が必要です。この目的のために利用できる可能性のある解決手段は、いくつも存在します。例えば時系列分析の場合、我々はデータをフィルタリングし、欠損値を含む全ての項目を除去することができます。あるいは、データの表記法に一貫性がない場合には、異常値や重複を除去するために、そのデータを訂正およびクレンジングする必要があります。こうした操作の全てがデータ準備の重要な構成要素であり、それに関する認識と重要性がともに高まり続けているのです。 将来に向かって進むために これら2つの領域(顧客需要とデータ品質)は、データ準備とデータ管理の領域において、および、そこで利用可能なツールにおいて、近年の発展を非常に強力に推進してきました。セルフサービス型のツールは、ますますユビキタスな存在となっており、データ品質を確保する機能要素との組み合わせによって、あらゆる領域で最良のソリューションを実現しています。 次回の投稿では、データ管理に関する新たな規制やガバナンス要件を取り上げます。

この記事はSAS Institute Japanが翻訳および編集したもので、もともとはGerhard Svolbaによって執筆されました。元記事はこちらです(英語)。 データサイエンティストはデータの取り扱いに多くの時間を費やします。データ品質は、ビジネス課題を解決するために機械学習を適用したり、AIモデルをトレーニングしたりする上での必須要件です。しかし、アナリティクスとデータサイエンスは、データ品質に関する要件を引き上げるだけではありません。データ品質の改善に多大な貢献を果たすこともできます。 欠損値の補完と複雑な外れ値の検出は、恐らくデータ品質に関して最もよく知られた2大アナリティクス機能ですが、決してこの2つだけがそうした機能というわけではありません。本稿では、アナリティクスでデータ品質を改善できる7つの方法についてご説明します 1. 外れ値の検出 アナリティクスは、標準偏差や分位数のような統計的指標に基づく外れ値検出において重要な役割を果たします。これにより、各変量ごとの外れ値の検出が可能になります。また、外れ値検出には、クラスター分析や距離尺度の手法を含めることもできます。これらの手法は、多変量の観点からデータ内の外れ値や異常値を特定することを可能にします。 予測モデルや時系列手法を用いた個々の外れ値検出は、許容範囲や最適な修正値を個別に計算することを可能にします。全体平均は、望ましくないバイアスを分析に混入させる恐れがありますが、グループ内平均はそれに代わる優れた選択肢となる可能性があります。 アナリティクスとデータサイエンスは、外れ値や妥当性の無い値の検出や特定を実行するための手法を提供するだけでなく、代わりに使用すべき最も蓋然性の高い値に関する提案も行います。 2. 欠損値の補完 アナリティクスは、横断的データや時系列データの中の欠損値に対する代替値を提供することができます。平均ベースの手法から、個別の補完値を生成する手法まで、様々な補完手法が存在しますが、いずれも決定木や、時系列向けのスプライン補完のようなアナリティクス手法に基づいています。欠損値の補完により、不完全なデータセットでも分析に使用することが可能になります。 3. データの標準化と重複除去 分析するに当たってユニークキーが利用できないデータベースの中で重複を特定および排除するタスクは、レコード間の類似度を記述する統計的手法に基づいて実行することが可能です。これらの手法は、住所、氏名、電話番号、口座番号のような情報に基づき、レコード間の近接度や類似度に関する指標を提供します。 4. 様々に異なるデータ量のハンドリング アナリティクスを活用すると、サンプルサイズの設計と検定力分析が求められる対照実験のための最適なサンプルサイズの設計が容易になります。予測モデル作成時にサンプルが小さい場合や、イベント数が少ない場合のために、アナリティクスは希少イベントをモデル化するための手法を提供します。時系列予測に関しても、アナリティクスでは、いわゆる「間欠需要モデル」を利用できます。このモデルは、不定期かつ低頻度に発生する非ゼロ数量のみを用いて時系列をモデル化します。 5. アナリティクスに基づく入力変数変換 アナリティクス手法は、選択した分析手法に適合するように、分布に対する変数変換を実行できます。対数変換や平方根変換は、例えば、「右に裾を引いているデータ」を正規分布に変換するために使用されます。 多くのカテゴリーを伴う変数に関しては、アナリティクスでは、カテゴリを組み合わせるための複数の手法を利用できます。この場合、複数のカテゴリーに対する組み合わせロジックは、各カテゴリー内のオブザベーション数と、ターゲット変数に対する関係とに左右されます。この手法の例としては、決定木や根拠の重み(WOE)計算があります。 テキストマイニングを利用すると、自由形式のテキストを、アナリティクス手法で処理可能な「構造化された情報」に変換することができます。 6. 予測モデル作成のための変数選択 変数選択のための手法は数多く存在します。これらを利用すると、予測モデルを作成する際に、ターゲット変数と強い関係を持つ変数のサブセットを特定することができます。これらの手法の例としては、R2(=決定係数)のようなシンプルな指標や、LARS、LASSO、ELASTIC NETのような高度な指標があります。 多くのアナリティクス手法は、分析モデル自体の中で変数選択のための様々なオプションが利用可能です。例えば、回帰における変数増加法、変数減少法、ステップワイズ法によるモデル選択などが挙げられます。 7. モデル品質やwhat-if分析の評価 アナリティクス・ツールはしばしば、モデルの作成や検証を支援するように設計されています。予測モデルの作成時には、例えば、利用可能なデータが持つ予測力を初期段階で素早く洞察することが重要となるケースは多々あります(これを「高速予測モデリング」と呼ぶこともあります)。 また、これらのツールは、モデルの品質やwhat-if分析用の特徴量を迅速に評価する手段も提供します。what-if分析は、変数や変数グループの重要度を判断する際に特に役立ちます。what-if分析は、特定の変数群が利用できない場合にモデルの予測力がどのように変化するか推計します。 これらの例の出典は、SAS Pressの書籍『Data Quality for Analytics Using SAS』(SASで実現するアナリティクス向けのデータ品質) です。ガーハード(Gerhard)氏によるコンテンツは、Github、SAS Support Communities、同氏のデータサイエンス関連書籍でも見つかります。


If you're curious what makes SAS a great workplace, one answer always rises to the top - our people. It's no secret that the people who work here are some of the best and brightest - not to mention the most passionate, accountable, authentic and curious people you'll ever meet. And at SAS, Your


Without the right data, any analytics initiative is just an illusion. For machine and deep learning efforts, new sources of data are always in demand. In a few of our Innovation at Scale study interviews, respondents pointed to the rising need for data hunters. I asked our resident guru on
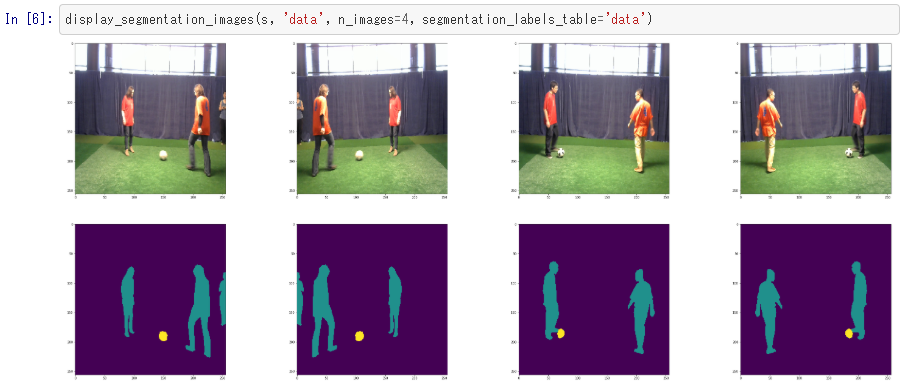

SAS Viyaのディープラーニング機能をPythonから利用するためのハイレベルAPIパッケージの最新版であるDLPy1.1では、主にCNN(Convolutional Neural Network)に関連する機能が拡張されています。 主な拡張機能: ・新たに3つのネットワーク構造に対応 【U-Net】 元々は、医療用画像のセグメンテーション向けに開発されたネットワークです。 (出典:https://lmb.informatik.uni-freiburg.de/people/ronneber/u-net/) 【MobileNet】 モバイル端末のようなリソースの少ない環境でも、畳み込み計算を分割(Depthwise Separable Convolution)することで、軽快に、素早く、そして精度の高い結果を得ることができると言われているネットワークです。 左が一般的な畳み込み構造。右が、MobileNetの構造。(出典:https://arxiv.org/pdf/1704.04861.pdf) 【ShuffleNet】 MobileNet同様に軽量軽快なネットワークですが、MobileNetでの畳み込みの分割に加えて、その名の通り、チャンネルをシャッフルしてチャンネル間での畳み込みを行い、特徴抽出を効率化するネットワーク構造です。 (出典:https://arxiv.org/pdf/1707.01083.pdf) ・上記ネットワーク構造に伴う、畳み込み層機能の拡張 【transpose convolution(転置畳み込み)】 Deconvolution(逆畳み込み)とも言われ、元となる画像に0 paddingして拡大してから畳み込む手法です。(上記U-Netに関連) 【group convolution(グループ化畳み込み)】 入力層をチャンネル方向にグループ分割して、グループごとに畳み込みを行い、最後に結合して出力する手法です。分割することで計算量を小さくすることができます。(上記MobileNet、ShuffleNetに関連) ・画像解析手法の拡張 【物体検出(Object Detection)手法にFaster R-CNNを追加】 R-CNNからFast R-CNN、そしてFaster R-CNNへと処理時間の短縮と精度向上が図られ進化してきているアルゴリズムです。 (出典:https://arxiv.org/pdf/1506.01497.pdf) DLPyの従来版からサポートしているYOLOに比べると処理時間はかかりますが、より高い精度を得ることができます。 【新たにセグメンテーション(Semantic Segmentation)に対応】 セグメンテーションは、画像中に存在する複数の物体や領域に対して、ピクセルレベルで推定する問題です。画像を入力すると、各画素に対して識別結果が付与された画像を出力します。一般的には、 Nクラスのセグメンテーションモデルは、Nチャンネルの出力画像を出力し、各チャンネルの画素値は各クラスの確率を表します。(上記U-Netに関連) 以上のように、PythonユーザーがDLPyを通して活用することができる、SAS Viyaのディープラーニング(CNN)機能が拡張されています。 ※DLPyの詳細に関しては、Githubサイトでご覧いただけます。 ※Enterprise Open Analytics Platform 「SAS Viya」 を知りたいなら「特設サイト」へGO!


Guest blogger Khari Villela shares tips to help you skip common pitfalls of building a data lake.
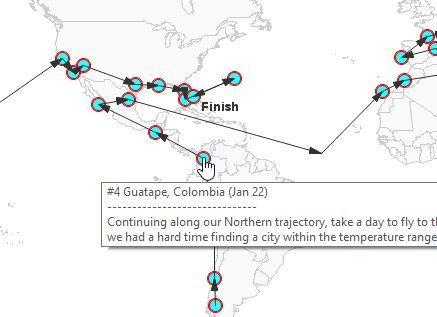

The guys over at reservations.com recently posted a really interesting idea, and a map to go along with it! They worked out an itinerary where you could spend one year traveling around the world (staying in a different place each week), and always be in a comfortable temperature around 70-75°
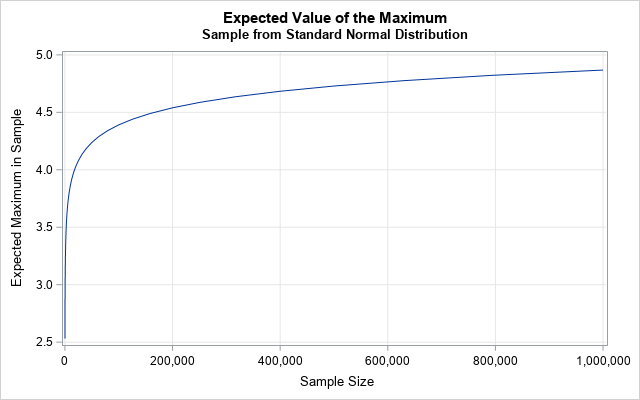

Is 4 an extreme value for the standard normal distribution? In high school, students learn the famous 68-95-99.7 rule, which is a way to remember that 99.7 percent of random observation from a normal distribution are within three standard deviations from the mean. For the standard normal distribution, the probability


The RANK procedure (PROC RANK) is useful for ranking numeric variables in a data set across observations. You often see PROC RANK used to rank data into quartiles, deciles, or percentiles. This action requires that you use the GROUPS= option in the PROC RANK statement. This blog answers three questions


La analítica omnicanal ofrece importante información detallada a lo largo del camino de toma de decisiones del cliente. En la actualidad, los minoristas tienen acceso a infinidad de datos que se pueden usar para dar forma a una experiencia de cliente superior en toda la cadena de valor. El


When a new Moon passes between the Earth and the Sun, the Moon can cast a shadow on certain regions of the Earth. This natural phenomenon creates a solar eclipse, meaning the Moon covers, or eclipses, your view of the Sun if you're in that region. No surprise that in


É curioso pensar que, hoje em dia, as tendências tecnológicas acabam por ter grande impacto no desenvolvimento de novos produtos e até nos próprios modelos de negócio das organizações. Começa, aliás, a ganhar corpo uma nova geração de modelos de negócio, quer sejam eles de pequenas ou grandes dimensões, que
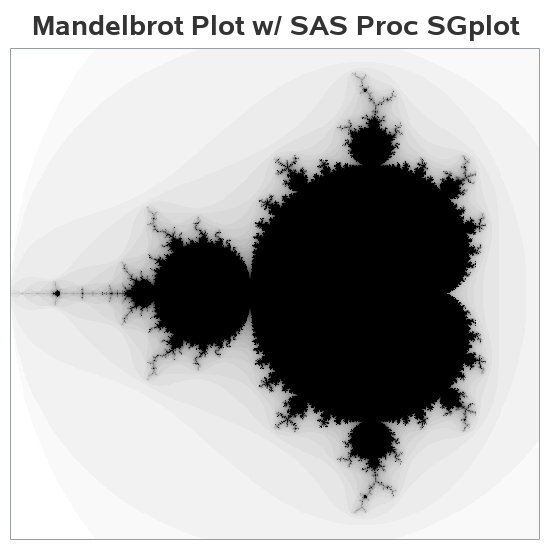
A few years ago Mandelbrot sets and fractals were all the rage! (Am I showing my age? Hahaha!) I thought creating some plots of this type of data would be a good way to sharpen my SAS programming skills, and it would make a nice/interesting example to help teach people


Building a predictive model is generally not the end of the project. Indeed, there is a major difference between building a model and actually getting it ready for people to use in their products and services. Even if the purpose of the model is to increase knowledge of the data,