All Posts


When I attend a conference, one of the first things I do is look at the agenda. This gives me a good overview of how my time will be spent. The next thing I do is find the detailed breakdown of sessions, so I can start building out my own
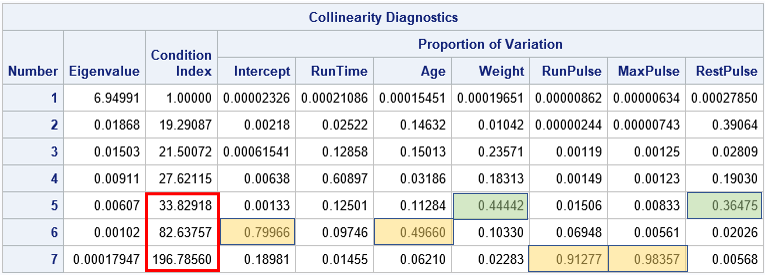

I was recently asked about how to interpret the output from the COLLIN (or COLLINOINT) option on the MODEL statement in PROC REG in SAS. The example in the documentation for PROC REG is correct but is somewhat terse regarding how to use the output to diagnose collinearity and how


This blog continues the conversation and about why innovations succeed or fail, and the importance of both timing and chance.


Learn how to get started with self-service data prep in these go-to articles.


Cuando hablamos de convertir datos en inteligencia no solamente estamos haciendo referencia a obtener de ellos conocimiento para tomar las mejores decisiones. También se trata de tener formas de comunicación mucho más efectivas e impactantes a través de capacidades avanzadas de visualización, para lograr que el conocimiento sea realmente usado


Ghee is a type of clarified butter that’s been used for thousands of years in Indian cooking and Ayurvedic medicine. Clarified butter simply means that the water and milk proteins have been removed from the butter, by cooking.


This guest post was written by Candice Creasman, PhD, owner of Creasman Counseling. The Work/Life Center is so grateful to Candice for sharing her expertise with SAS employees and their families. You can learn more about Candice and Creasman Counseling at the bottom of this page. Should I Stay or


One great thing about being a SAS programmer is that you never run out of new things to learn. SAS often gives us a variety of methods to produce the same result. One good example of this is the DATA step and PROC SQL, both of which manipulate data. The

A relação do SAS com a Lusitania Seguros – a 1ª Companhia de Seguros a surgir no mercado segurador com capitais 100% nacionais – data de 2014, aquando da implementação da solução de Firmwide Risk Management, com o projeto de Solvência II. Dois anos mais tarde, foi implementada a Solução


Subscription fraud ‘disappearing acts’ have economic, human and reputational consequences. What were initially isolated cases have now become a systemic industry issue for telecommunication companies worldwide. In fact, the CFCA reports an approximate $2.03 Bn. lost to fraud every year due to subscription fraud through impersonation. Other variants of subscription fraud through applications and ‘credit muling’ contribute an additional $1.93 Bn. and $1.75 Bn. respectively.


AI innovations range from unique modelling techniques and computer vision efforts to medical diagnostic tools and self-driving cars. Within that wide range of technology, what should you consider patenting? Which of your discoveries are true intellectual property that necessitate protection? A little thought upfront could help you to know what
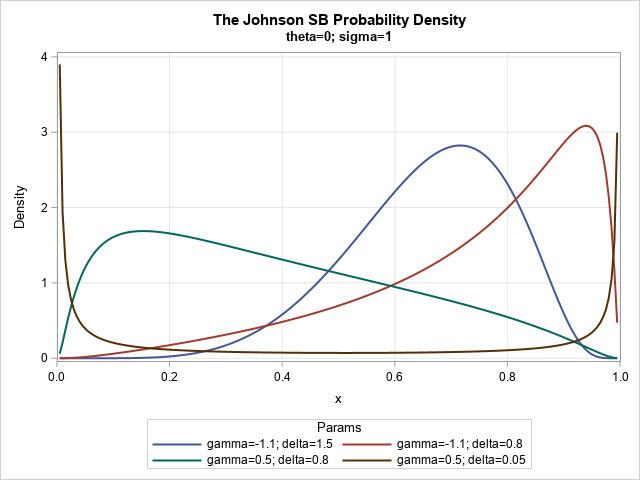
From the early days of probability and statistics, researchers have tried to organize and categorize parametric probability distributions. For example, Pearson (1895, 1901, and 1916) developed a system of seven distributions, which was later called the Pearson system. The main idea behind a "system" of distributions is that for each
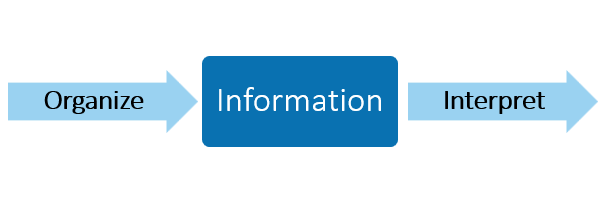

Where in your business process can analytics and AI play a contributing role in enhancing your decision making capability? At the information interpretation stage. As a framework for understanding where analytic and AI opportunities may arise, the simple diagram below illustrates the relationships between data, information and knowledge, and how


I asked Jaimy van Dijk if it's true or false if analytics has huge potential in sport.
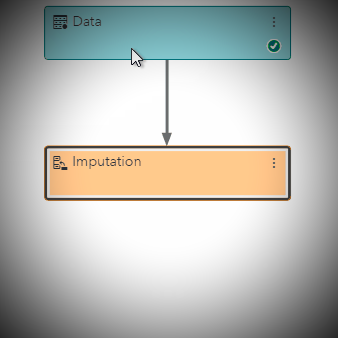

This blog is part of a series on SAS Visual Data Mining and Machine Learning (VDMML). If you're new to SAS VDMML and you want a brief overview of the features available, check out my last blog post! This blog will discuss types of missing data and how to use imputation