All Posts


Today’s business banking models are changing. Internal rating models enjoyed the spotlight for a long time, but new topics are already catching on. Machine learning and artificial intelligence are key new elements in addition to traditional techniques for model development. EU and international regulators have also taken an active interest


La gestión del riesgo de crédito, también conocida como gestión del riesgo crediticio, es uno de los principales desafíos que enfrentarán empresas de sectores como el financiero, el asegurador, de telecomunicaciones o comercio en este 2020. Es frecuente que muchas de estas empresas lo hagan pensando en dar cumplimiento a


How do you convince busy IT integration partners to take a deep dive into new technology without asking them to also first sell a solution to a client? After all, time is money for implementation partners. At SAS, we are keen to introduce our partners and, through them, more clients


In a previous article, I showed how to perform collinearity diagnostics in SAS by using the COLLIN option in the MODEL statement in PROC REG. For models that contain an intercept term, I noted that there has been considerable debate about whether the data vectors should be mean-centered prior to


Meet Stefan Stoyanov. He’s an MSc Business Analytics student with a passion for emerging technologies, ranging from artificial intelligence to augmented and virtual reality.

Oggi i modelli di business nel settore bancario stanno cambiando: i modelli di internal rating sono stati a lungo sotto i riflettori, ma nuove tecniche di modellazione stanno già prendendo piede. Machine Learning e Intelligenza Artificiale sono nuovi elementi chiave che si aggiungono alle tecniche tradizionali per lo sviluppo dei


O ano 2019 foi especial para o SAS Portugal, porque comemorámos o nosso 25º aniversário. Foram vários os momentos de celebração, não só no SAS Fórum Portugal, como em alguns momentos especiais com clientes de vários anos. Para fechar este ano, e depois de uma série de artigos aqui publicados


Natural Language Processing can offer invaluable benefits to councils and increase resident satisfaction.


This blog post demonstrates process and SAS coding techniques to shift dates by a given number of workdays accounting for weekends and holidays.
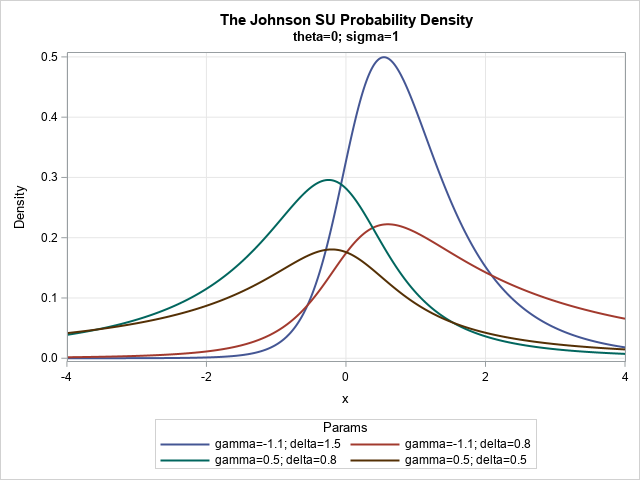
The Johnson system (Johnson, 1949) contains a family of four distributions: the normal distribution, the lognormal distribution, the SB distribution (which models bounded distributions), and the SU distribution (which models unbounded distributions). Note that 'B' stands for 'bounded' and 'U' stands for 'unbounded.' A previous article explains the purpose of


Aunque el costo exacto es incalculable, las pérdidas por fraude representan aproximadamente el 5% de los ingresos anuales de una organización, según la Asociación de Examinadores de Fraude Certificados (ACFE). Se calcula que diariamente son saqueados más de 11 mil millones de dólares a la economía global producto de robos,
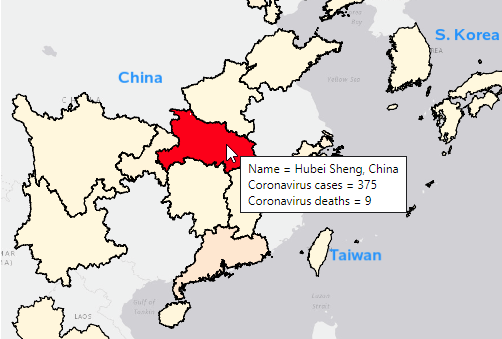

The coronavirus has been a big item in the news lately - it's a pneumonia-like illness that has killed several people. It's thought to have started in China, and has spread to several other countries (including at least one case in the U.S.). The World Health Organization says the coronavirus


Mathematics and artificial intelligence (AI) are natural partners. I can only apologise to anyone who hated maths at school for this statement, but to my mind, it’s impossible to engage with AI without understanding some maths. One commentator summed it up: “A person working in the field of AI who


In my previous post, I shared how I’ve been working on a fascinating project with one of the world's largest pharmaceutical companies. The company is applying SAS Viya computer vision capabilities to an advanced medical device to help identify potential quality issues on the production line. By providing 100% visual
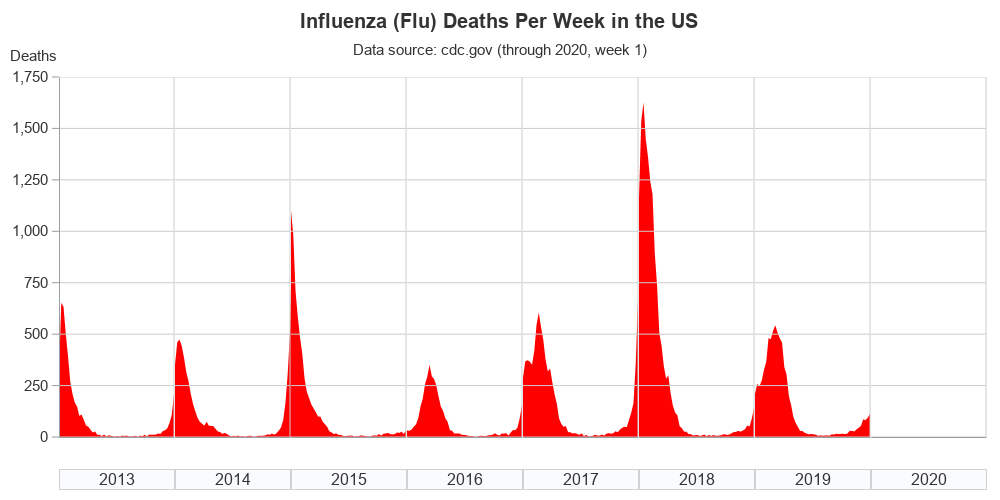
The flu season has started here in the U.S., and according to the Centers for Disease Control and Prevention (CDC) data it has caused 214 deaths in the first week of 2020. Is this number higher, or lower, than usual? When does the flu season start, and how long does