All Posts

SAS Global Forum 2021 will be jam-packed with inspiring content. Register today to ensure you don't miss a second of this year's event.


Interview with Dr. Christian Rammer (ZEW), who leads projects as far as innovation economics and business dynamics at ZEW.

La transformation numérique est devenue un facteur déterminant de compétitivité pour les industriels. Elle leur permet de gagner en flexibilité, agilité et adaptabilité et ainsi de devenir des entreprises plus résilientes, capables de résister aux incertitudes et crises qui secouent leur marché. Pour assurer son avenir, l’industrie doit savoir tirer


In the second of two posts spotlighting SAS R&D innovators, SAS' Udo Sglavo interviews Chris Barefoot, Matthew Galati, Courtney Ambrozic and Davood Hajinezhad.


Curiosity is at the heart of everything we do here at SAS. It’s how we got our start, and it’s what will continue to drive us forward. Our people take pride in using their curiosity and creativity to answer all sorts of questions – questions that help customers, communities, and people around the world. Today, hear the unique stories of just a few of
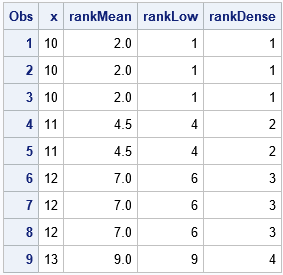

The ranks of a set of data values are used in many nonparametric statistics and statistical tests. When you request a statistic or nonparametric test in SAS, the procedure will automatically compute the ranks that are needed. However, sometimes it is useful to know how to compute the ranks yourself.
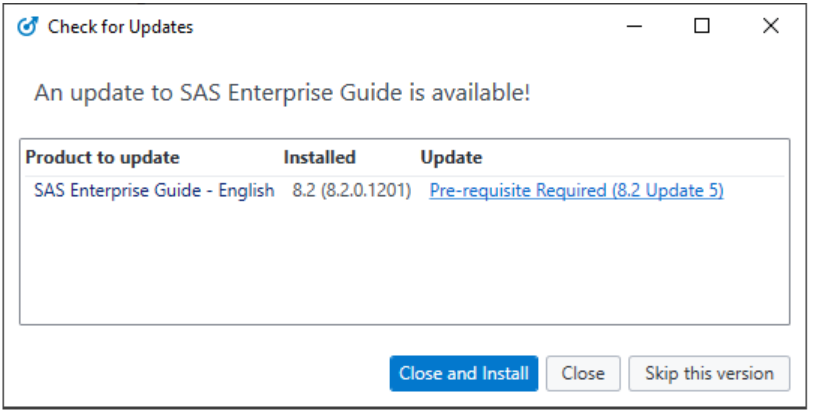

若您在 EG 8.2 進行更新 遇到更新錯誤: "An error occurred . . . Unable to download the update." 1.請先關閉您的 EG 開啟您的 EG 安裝路徑,一般可以在以下路徑找到: C:Program Files (x86)SASHomex86SASEnterpriseGuide8 C:Program FilesSASHomeSASEnterpriseGuide8 2. 請將 既有的 AutoUpdate.exe 檔案 重新命名為 AutoUpdate_OLD.exe 3. 於連結: https://tshf.sas.com/techsup/download/hotfix/HF2/BIRD/autoupdate/66676/AutoUpdate.exe 下載新的檔案 AutoUpdate.exe 後,移至 EG 安裝路徑資料夾中 4. 當您重啟 EG 再次進行更新時,即可成功更新 請參考: https://support.sas.com/kb/66/676.html


Predictive models and medical image analysis have the potential to transform health care delivery. To accelerate innovative approaches in health analytics, teams around the world are participating in a global hackathon. In scientific communities, it's well-known that the fastest way to drive progress and discover new ideas is collaboration with
In the first of two posts spotlighting SAS R&D innovators, SAS' Udo Sglavo introduces you to developers Amy Shi, Maggie Du and Phil Helmkamp.


L’Ecole Supérieure de Sureté des Entreprises (ESS-E) et SAS ont formé un groupe d’experts (issus du public et du privé) pour développer, en France, les méthodes, les formations et les outils d’investigations adaptés aux données massives. En fin d’année 2020, SAS et L’École Supérieure de la Sûreté des Entreprises (ESS-E)


Minimize processed foods, cook more meals from scratch…we know, we know. But let’s be honest, making the transition away from packaged, processed foods is tough - they’re convenient and comfortable, I get it. However, homemade versions are often cheaper, almost always taste better and really aren’t difficult to make.


SAS' Leonid Batkhan explores shell scripting as an alternative way to implement parallel processing.
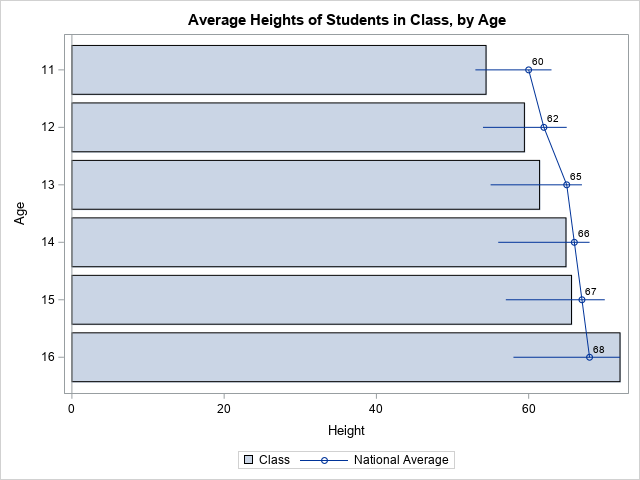
It can be frustrating to receive an error message from statistical software. In the early days of the SAS statistical graphics (SG) procedures, an error message that I dreaded was ERROR: Attempting to overlay incompatible plot or chart types. This error message appears when you attempt to use PROC SGPLOT


Dutch project aims to increase safety of gall bladder surgery Predictive models and medical image analysis have the potential to transform health care delivery today. To accelerate the innovative approaches, teams around the world are converging in a global hackathon as organized by SAS to advance the field of health


A solid business strategy addresses insurance accounting standards and much more.