Search Results: developer (575)

Analytics | Data Visualization
Stijn Rogiers 0
One small step for prostate cancer patients, one giant leap for prostate cancer research

In May, I joined several SAS colleagues, academics, clinicians, pharmaceutical companies, and other information and technology specialists for the first-ever IMI PIONEER Hackathon for prostate cancer research. A few weeks later, as I watched the SpaceX launch on TV, it occurred to me that space trips and cancer research have

Advanced Analytics | Analytics | Artificial Intelligence | Machine Learning | SAS Administrators
Keith Renison 0
Coming soon: Your SAS software, continuously updated

If you're my kids, the term, “continuous integration,” might have you thinking about how much time you’ve spent lately with the family, and “continuous delivery” is what's been happening on the front porch the past few weeks. But to a software developer, these terms mean something entirely different. Combined and

Analytics | Data Management
John Gottula 0
From 9 cows to the future of agtech

The COVID-19 pandemic challenged agriculture and supply chains, but the overarching resilience of agriculture around the world speaks to the industry's efficiency, built-in redundancy and indispensability. In the US, flourishing interactions between government, industry and academic stakeholders underscore how ag represents unity and consilience. And there may be no better

Work & Life at SAS
Alyssa Grube 0
Be a light to your community

Written by Allison Hines and Kara Roberts  During this global pandemic, we’ve seen SAS employees band together, while staying apart. We know that there’s strength in numbers, and amazing things happen when we all bring our unique skills and abilities to the table. We’re proud of the creative ways our employees are giving back, like making masks and preparing food for their communities. Keep reading

Advanced Analytics | Data Visualization | Programming Tips
Xavier Bizoux 0
Continuous Integration/Continuous Delivery – Using Python and REST APIs for SAS Visual Analytics reports

With increasing interest in Continuous Integration/Continuous Delivery (CI/CD), many SAS Users want to know what can be done for Visual Analytics reports. In this article, I will explain how to use Python and SAS Viya REST APIs to extract a report from a SAS Viya environment and import it into another environment.

SAS Administrators
Gerry Nelson 0
Jobs: Stored processes in Viya

Stored processes were a very popular feature in SAS 9.4. They were used in reporting, analytics and web application development. In Viya, the equivalent feature is jobs. Using jobs the same way as stored processes was enhanced in Viya 3.5. In addition, there is preliminary support for promoting 9.4 stored processes to Viya. In this post, I will examine what is sure to be a popular feature for SAS 9.4 users starting out with Viya.

Artificial Intelligence | Machine Learning
Claudio Broggio 0
Protecting your intellectual property in the brave new world of AI and machine learning

AI innovations range from unique modelling techniques and computer vision efforts to medical diagnostic tools and self-driving cars. Within that wide range of technology, what should you consider patenting? Which of your discoveries are true intellectual property that necessitate protection? A little thought upfront could help you to know what

Analytics
0
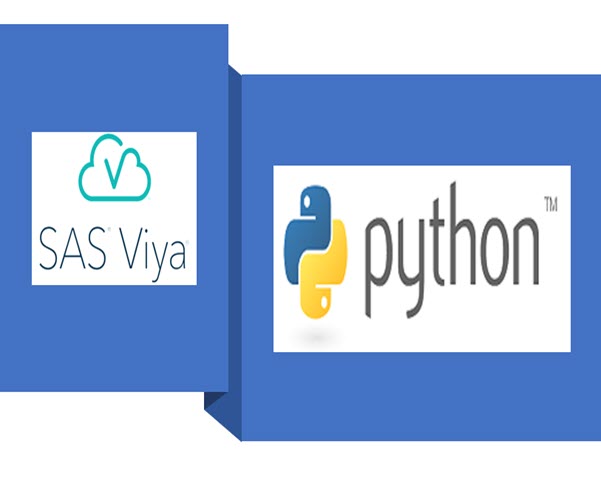
R言語でSAS ViyaのAI機能活用 第二回「アクションセットと最初のデータ読み込み」

概要 第一回の「CASサーバーとSWATパッケージ」に続き、第二回としてCASのアクションセットの活用やCASサーバーへのデータ読み込みなどの基本操作の方法について紹介します。 アクションセットについて CASサーバー上での分析作業を開始する前に、“アクションセット”という重要な概念に関して紹介します。 アクションセットは、関連する機能を実行するアクションの論理的なグループです。 SAS Viyaでは、関数のことを「アクション」、関連する関数のグループを「アクションセット」と呼んでいます。アクションでは、サーバーのセットアップに関する情報を返したり、データをロードしたり、高度な分析を実行するなど、さまざまな処理を実行できます。 アクションセットを使ってみましょう それでは、サンプルコードを使いながら、SAS Viyaのアクションセットでデータの読み込みからプロットまでの一連の操作を説明します。 ・データの読み込み CASサーバーにデータを読み込むには二つの方法があります。一つはread.csv()でcsvファイルをRデータフレームの形で読み込んだ上で、as.casTable()を使用する方法です。この関数はデータをRのデータフレームからCASテーブルにアップロードすることができます。今回の例では金融関連のサンプルデータhmeqを使って紹介します。 library("swat") conn <- CAS(server, port, username, password, protocol = "http")   hmeq_data <- read.csv(“hmeq.csv”) hmeq_cas <- as.casTable(conn, hmeq) もう一つはcas.read.csv()を使って、ローカルからファイルを読み込んで、そのままCASサーバーにアップロードする方法です。仕組みとしては、一つ目の方法と大きくは変わりません。 hmeq_cas <- cas.read.csv(conn, hmeq) as.casTable()或いはcas.read.csv()からの出力はCASTableオブジェクトです。その中に、接続情報、作成されたテーブルの名前、テーブルが作成されたcaslib(CASライブラリ)、およびその他の情報が含まれます。 Rのattributes()関数を使えば中身を確認できます。 attributes(hmeq_cas) $conn CAS(hostname=server, port=8777, username=user, session=ca2ed63c-0945-204b-b4f3-8f6e82b133c0, protocol=http) $tname [1] "IRIS" $caslib [1] "CASUSER(user)"

Advanced Analytics | Machine Learning
Wayne Thompson 0
Why you should add statistical learning to your machine learning tool kit

Data scientists naturally use a lot of machine learning algorithms, which work well for detecting patterns, automating simple tasks, generalizing responses and other data heavy tasks. As a subfield of computer science, machine learning evolved from the study of pattern recognition and computational learning theory in artificial intelligence. Over time, machine learning has borrowed from many

1 4 5 6 7 8 20