Search Results: Visual Analytics (1617)

Mike Gilliland 0
Forecast Value Added Q&A (Part 7)

Mercifully, we have reached the final installment of Q&A from the June 20 Foresight-SAS webinar, "Forecast Value Added: A Reality Check on Forecasting Practices." As a reminder, a recording of the webinar is available for on-demand review, and the Foresight article (upon which the webinar was based) is available for free

Thomas Keil 0
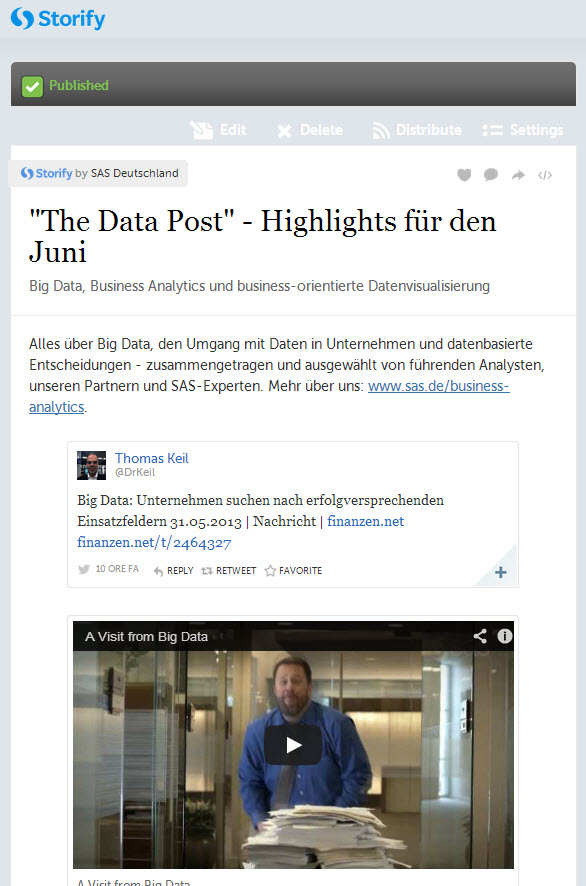
"The Data Post" - die Web-Highlights des Monats

Einmal pro Monat fassen wir ab jetzt Studien, Videos und Veröffentlichungen über Big Data, Business Analytics und Datenvisualisierung für Sie zusammen. Das Wichtigste über den Umgang mit Daten in Unternehmen und datenbasierte Entscheidungen - im Web gefunden, zusammengetragen und ausgewählt von führenden Analysten, unseren Partnern und SAS-Experten. Zur aktuellen Ausgabe: "The

Data Visualization
Sanjay Matange 0
Report from SESUG 2012

This SESUG conference was a very energetic and rewarding experience, with many user presentations on graphics using SAS/GRAPH and ODS Graphics. One standout presentation for me was on "Data Merging and Exploration to Identify Associations Between Environmental Factors and Disease Outbreaks" by Neeta Shenvi, et. al.  The key part of

Mike Gilliland 0
Forecasting fashion apparel (Part 2)

Have you noticed the annoying stock art they put on The BFD blog header? All I can think of is "If those idiots only used SAS Forecast Server, they wouldn't have to draw graphs all over their window panes just to do forecasting." It must really p.o. the housekeeping staff at that

Analytics | SAS Events
0
Our conference lineup for 2012

Here at SAS Publishing, we’ve started the new year off with a bang, particularly when it comes to conferences. We’re attending a number of new shows in addition to the usual lineup this year. Visit our booth, meet our authors, check out our new and forthcoming titles, and talk with

Chris Hemedinger 0
Too many pies can be hard to digest

On his SAS and R blog, Ken K. recently posted an example of a visualization technique called "small multiples". In this exercise, Ken shows the programming technique for replicating a particular series of pie charts in R as well as in SAS. It's a useful exercise to learn from, but

Anne-Lindsay Beall 0
WUSS up San Francisco??

The Western Users of SAS Software (WUSS) have the best acronym ever, and they're putting on an amazing conference in San Francisco this week.  The conference kicked off today with conference chairs Kathryn Valdes and Ginger Carey’s announcement that the Pacific Northwest Users Group is merging with WUSS next year, adding

Advanced Analytics
Mike Gilliland 0
The New (BF) Deal

We had a tornado in April, an earthquake on Tuesday, a drought all summer, and a hurricane arrives on Saturday. All I can figure is that Cary, NC has way too many sinners per capita. What's next -- pestilence? The BFD Makeover The BFD (and all SAS blogs) will now be

SAS Events
Chris Hemedinger 0
SAS programmers: meet Twitter

"Twitter, thou art nought but data." So sayeth the SAS programmer. Many data analysts now recognize Twitter for what it is: a tremendous source of data covering almost any topic, from Justin Bieber's hair to political uprisings to technical conferences to company brands. SAS offers sophisticated solutions to harness this

Waynette Tubbs 0
SASonality = Sy Truong

I've never met Sy Truong face-to-face. (That will be one of the top items on my SAS Global Forum 2011 to-dos.) I’ve talked with him on Twitter and enjoyed his blog so much that I listed it in an edition of the SAS Tech Report. I’ve even talked with him

Chris Hemedinger 0
This is your database...on SAS

Curt Monash posted a nice summary of the current and planned offerings that help to make SAS analytics more available "in the database" -- allowing you to analyze your data quickly without having to move it around so much. If you use SAS with Teradata, Netezza, or DB2, much of

Waynette Tubbs 0
Technology Connection Reloaded

One of the events I look forward to every year is the unveiling of a year’s worth of SAS R&D’s magic. It occurs during the SAS Global Forum Technology Connection. Today’s show was all we could have hoped it would be! We heard from some SAS software, technology and statistics

Chris Hemedinger 0
"Open in JMP" from SAS Enterprise Guide

The SAS Visual Data Discovery package includes, among other things, SAS Enterprise Guide and JMP. If you are among the growing numbers who use these two software applications together, you might be looking for more ways to integrate the two. Here's one way: a SAS Enterprise Guide task that opens

1 52 53 54