On his SAS and R blog, Ken K. recently posted an example of a visualization technique called "small multiples".
In this exercise, Ken shows the programming technique for replicating a particular series of pie charts in R as well as in SAS. It's a useful exercise to learn from, but I wasn't crazy about this method for visualizing the particular data that Ken used. The data set contains values for the popularity, salary, and unemployment rates for college majors. Since last week was Computer Science Education Week, and Computer Science compared favorably in the results, I was interested in featuring a different visualization for this.
That's when I challenged one of our SAS visualization experts, Robert Allison, to take a shot at it. Initially, Robert didn't bite. But then someone else asked him to try, and he relented. (That's how much pull I have around here.)
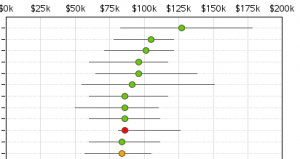 In my opinion, Robert's result is easier to read and easier to understand. It's easier to see "ranking" of disciplines by the interquartile ranges, and there is a visual indication (albiet a bit arbitrary) as to whether each discipline has low, medium, or high unemployment rates. (Note: I believe that the "small multiples" technique can be very useful with other types of charts, such as series, small bars, etc.; just not with so many pie charts...)
Compare for yourself:
- See Ken's original blog with the series of pie charts.
- See Robert's alternative view of the data
- See the SAS program that Robert created to produce his result
- See the article about Robert's efforts, featured on the SAS Family web site as part of CSEdWeek
Note: I shared this result with Ken in the comments on his blog. He appreciated the effort, and responded with a bit of critique, highlighting some of the tradeoffs that result in this alternative version.

8 Comments
As a philosophy major, I object to the grouping of Philosophy and Religious Studies -- these are about as opposite as two subjects can be. Plus, all the unemployed (and jailed) preachers are weighing down our score.
Other than that, those pie charts are insane -- a visual assault and can't make any sense of them. My vote is for Robert.
Mike,
"Theology and Religious Vocations" has its own category, so you'll have to come up with another excuse.
Plus, I think that some would consider Forecasting a religion of its own. So maybe that's your category after all.
Chris
I had to fix the code to get it to work, changing line 36 to:
/*Unemployment=.;*/ Unemployment=unemployment_percent/100.0;/*,percent7.1);*/ /* convert character percent to numeric */
Odd that the original program was publish and yet doesn't run... ?
Thanks to Tom for pointing this out. The program works as expected in SAS 9.2, but not with SAS 9.1.3. The reason is that PROC IMPORT reads the percentage value from the text file as CHARACTER data in 9.2 (to prevent potential confusion over how to interpret the raw values). But in 9.1.3, the IMPORT procedure reads them as NUMERIC, and so the line in the program that attempts to use the INPUT function with the PERCENT format generates a missing value.
Special thanks to Tom for several back-and-forth messages as we sorted this out.
I have found it very frustrating to post a comment, ask a question or to reply to a question someone has asked. That being the case, I am asking my question here and hope that you do not get upset.
In my business, we get Excel data that is supposed to be a date in a particular format. However, the data comes to us in all forms. For example, 01-12-01 could mean 1 Dec, 2001, or 12 Jan, 2001. Sometimes the incoming data can be as 010101! SAS will read this data into a dataset based upon an input format. If I specify the date to be dd-mmm-yyyy, it will read at least some of the data incorrectly.
Does anyone have any thoughts on how I can do some SAS magic and interpret all such anomolies as DDMMMYYYY, as SAS likes a DATE?
The best place to ask such questions and receive a quick answer from the community: communities.sas.com. You'll find active discussion forums for all sorts of SAS topics, including programming/data related topics such as this one.
As far as a specific answer, I recommend looking at the ANYDTDTE informat. Note that the DATESTYLE system option is used to control how day/month/year order is interpreted for the data values that you're reading in.
Thanks! Now all I have to do is locate a button that says "Ask Question" or "reply". THANKS!
To use Communities.sas.com, you must log in with a SAS profile (see the Create Profile link on the top of the support.sas.com page). Setting up a profile is free and does not obligate you to receive any unwanted e-mails or other communication -- it simply defines Who You Are on the SAS support site, so that you may interact with your peers.