Data Visualization

Get the right information, with visual impact, to the people who need it
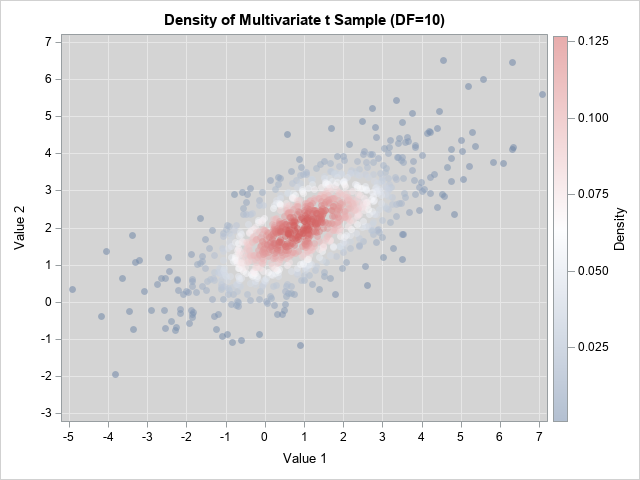
Analytics | Data Visualization
Michael Herrmann 0
Sind Sie ein Geodät ?

Sind Sie ein Geodät ? Tragen Sie Ihr Smartphone in den Wald? Wenn, dann wohl eher unbewusst und ohne einen expliziten Standpunkt zu suchen... Ihr Smartphone hat einen – und zwar so plus/minus fünf Meter genau. Und das ist gleichzeitig der Ausgangspunkt für eine visuelle Verbesserung der Welt – einfach so beim

Data Visualization
Sanjay Matange 0
Diagrams with curved links

Let us continue with our journey beyond standard plots and charts.  Often we need to create some simple diagrams to visualize the connections between different entities such as patients and providers or even a social network. Many of you may not have a custom tool to create diagrams.  But you have Base SAS, so

Data Visualization
Sanjay Matange 0
Infographics Bar Chart

Last week I posted an article on creating Infographics using SAS.   The interest shown by the SAS community in this topic came as a surprise.  Also, it so happened by coincidence, a SAS users also  called into Tech Support just about the same time with a query about creating  Infographics type graph

1 35 36 37 38 39 56

Back to Top