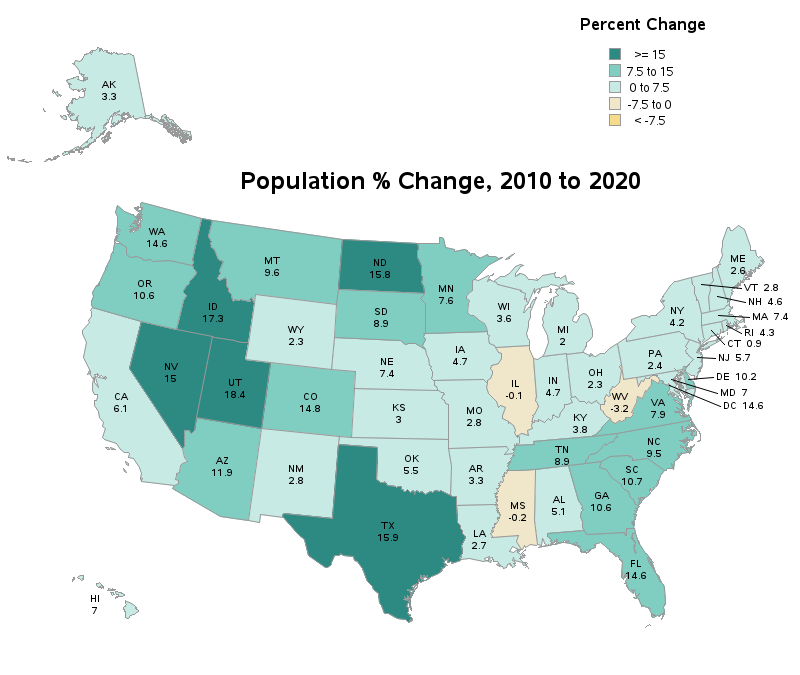
Where are people moving to/from in the US?

With the 2020 Census numbers starting to come out, it's interesting to look at what states are gaining (or losing) people. In this example, I create a custom map similar to the ones the US Census Bureau likes to use, and plot the 10-year change in population. But before we