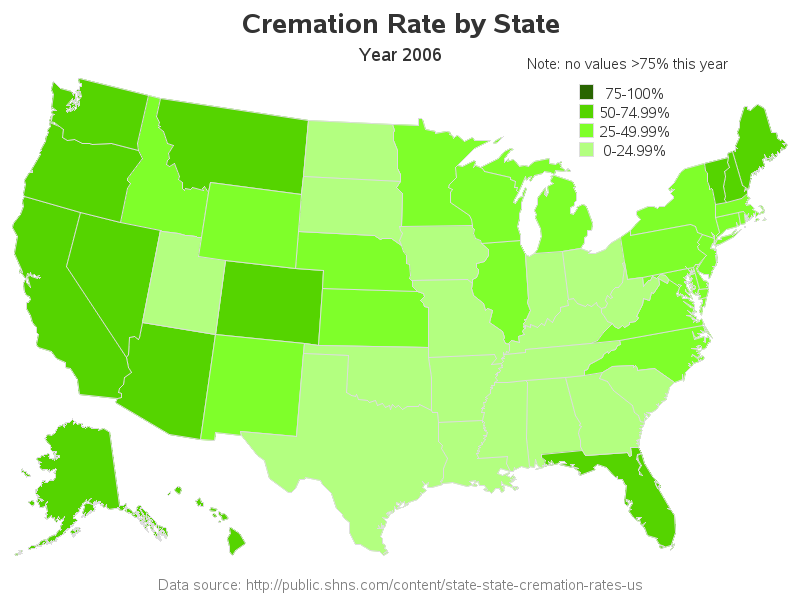
This blog post describes a neat example of some cool SAS capabilities, and also teaches you a little more about the state where SAS software is made... Here at the SAS headquarters in Cary, NC, the main TV news channel is WRAL TV5. And my favorite segment during the news is Scott
Tag: maps
In light of the recent reports that glaciers in Antarctica are melting, what SAS graphs might be useful in analyzing the data?... When floating sea ice melts (such as at the North Pole), it doesn't raise the sea level - but when ice on land melts (such as glaciers at
I'm sure that anyone in the world would do whatever they could to help find the missing Flight 370 ... and this is my attempt to do what I can. In my previous blog post, I showed how SAS could be used to visualize the locations where planes have disappeared. This blog
With all the recent news reports about the missing Flight 370, I wondered what other airplanes have disappeared without a trace ... and I used SAS to visualize that data! There was in interesting infographic on the Bloomberg website that sort of answered my question, but their map just had
In the Breaking Bad TV series, Walter White has an impressive lab where he secretly makes the illegal drug methamphetamine (meth). Wouldn't it be cool to use SAS to show the locations of all the clandestine meth labs in the US?!? Let's do it!... In this blog, I show you
We get very little snow in Wake County, NC (SAS Headquarters) - therefore when we do have snow, it's a big deal and they close the schools. Which made me wonder ... how much snow does it take to close schools in the rest of the US? Last week we got our
Since mead is becoming popular in movies (such as Thor and The Hobbit), and even as an emerging industry in real life ... what better example to use for some SAS graphs! And who knows - this might even turn you into a mead drinker! But first, to get you in the
In previous versions of SAS, if you wanted to experiment with creating U.S. maps in Proc GMAP, there wasn't any good sample data available. Unless you had your own data available, you probably ended up using the maps.us x/y points as your DATA= ... which is sort of a nonsense
SAS 9.3 already has smooth (anti-aliased) lines in SAS/GRAPH device=png output, and in SAS 9.4 you will also get smooth lines in your device=gif output (and gif animations)! Woo-hoo!!! Here are a couple of simple examples to demonstrate: The first example is device=gif Proc Gmap output. If you look very closely, you'll notice that
You might have seen my previous blog, where I plotted some interesting tourist attractions on a geographical map of the British Isles (which may be of interest to Analytics 2013 Conference delegates)... Well this blog uses even more powerful analytics, and shows how SAS can calculate the "optimal tour" to visit all
Are you going to Analytics 2013 in London?!? And if so, have you found any fun/interesting/touristy things to do while you're there? ... Being an analytics conference, I thought it would be good to apply some "analytics" to the task! So I took some locations in the British Isles that I thought
I recently read an interesting article in The Economist, where they describe "The Big Mac index." This is an index they invented as a lighthearted guide to compare currencies in different countries. In their article they create a multi-panel display (similar to a dashboard) where they compare the index for several countries using
We had some fierce wind storms all across the United States yesterday, which even spawned some tornadoes! It looks like we weathered the storm OK here in Cary (but I still need to run out to the lake and make sure my pontoon/houseboat is still there, agh!). Anyway ... as with other
In the U.S. we have a presidential election every 4 years - and as luck would have it, 2012 is an election year! I see a lot of election maps & graphs in the news, and I'm always subconsciously critiquing them in my mind and thinking to myself, "How would I graph this
You've all heard about the recent meningitis outbreak, right? Being a data-guy and a map-guy, I went looking for maps related to the outbreak. I found the following map on the Centers for Disease Control (CDC) website. It shows the states that received the recalled drug used in epidurals (for back
Avast Mateys! Did you know that International Talk Like a Pirate Day is coming up?!? (September 19) Here's the official website, if you'd like more info. And what better way to get into the spirit of things than to use SAS/GRAPH to plot some real pirate data - Arrrr!!! Here's
A while back, I had seen the following map on the CEOs for Cities website. It seemed like an interesting topic and an interesting map, but I just couldn't grok what their map was saying ... So I decided to download the data and create my own map with SAS. I
Have you ever tried to put something on the Web, and then it looks different for other people (or maybe doesn't work at all)? ... And you eventually found that it was because they were using a different browser? That's one of the reasons I like traditional SAS/Graph output -- it's simple
Everyone in the world has their attention turned towards the Olympics this week, so what better topic to tie in to a SAS/GRAPH blog than that?!?! I had seen a graph on the guardian website that I thought was interesting, so I decided to try to create my own (slightly different)
Charlie Huang recently posted an article on a new way to draw maps using SGPlot procedure. The basic idea is simple, just use the SCATTER statement to plot the (x, y) points from the data sets in the MAPS library. The GROUP option can be used to color the markers for each
Growing up in Michigan, I, like all state residents, learned early on that the lower peninsula of Michigan is shaped like a mitten. This piece of information has served me well all my life; whenever I meet a stranger who wants to know where in Michigan I grew up, I
I've written about this topic before, but find that more people are interested in how this works. Hoping to provide more detail below. Let me know if I missed anything! When using the 'GEO' dimension type in SAS OLAP Cubes, users will not see anything new unless the OLAP cube
The SAS Business Intelligence suite includes the ability to map data via the ESRI Map Service within various web clients (and even Enterprise Guide). Steps: Create an ESRI Map via ArcMap Publish to ArcGIS Server via ArcCatalog Define a New Map Service in SAS Management Console Set a cube dimension as
While working on a SAS OLAP and ESRI project, I was asked about geocoding addresses. Fortunately, Jeff Phillips, one of the SAS presenters at SESUG09 gave a talk about PROC GEOCODE. In SAS 9.2, street addresses can be given x/y coordinates via the geocode procedure using the 5 or 9