Analyzing demographics and patterns-of-life using SAS Visual Analytics

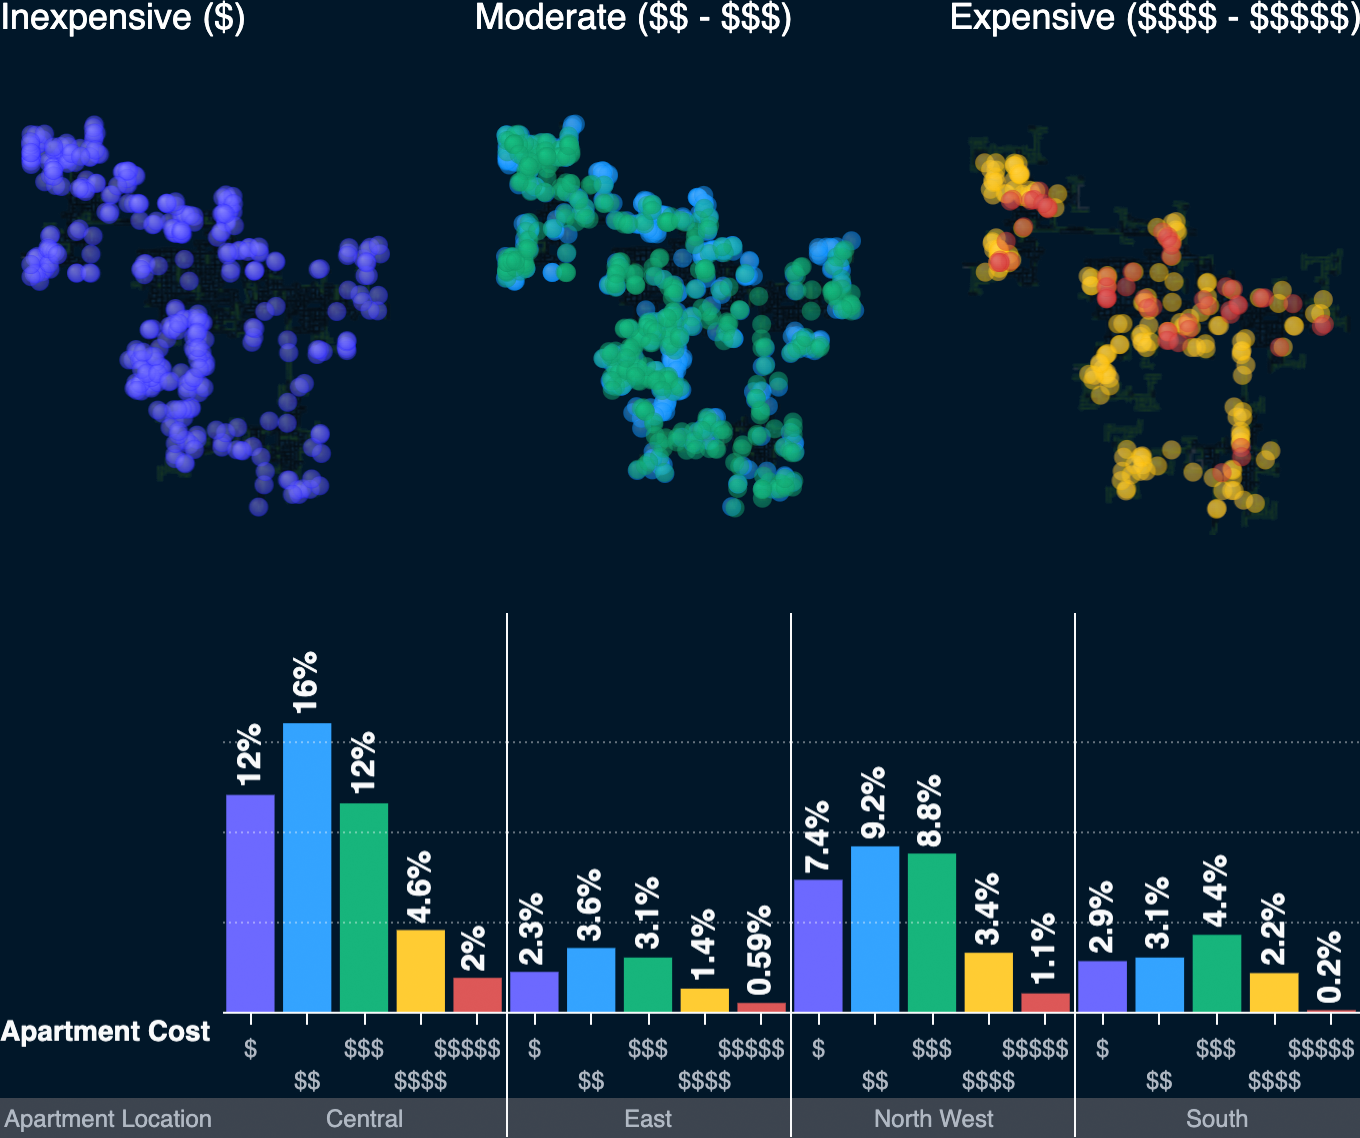
The IEEE Visual Analytics Science and Technology (VAST) Challenge provides a great opportunity to validate our software against real-world scenarios using complex data sets. Not only do we learn from these projects, but we also send feedback to our development teams to further improve product capabilities for customers.